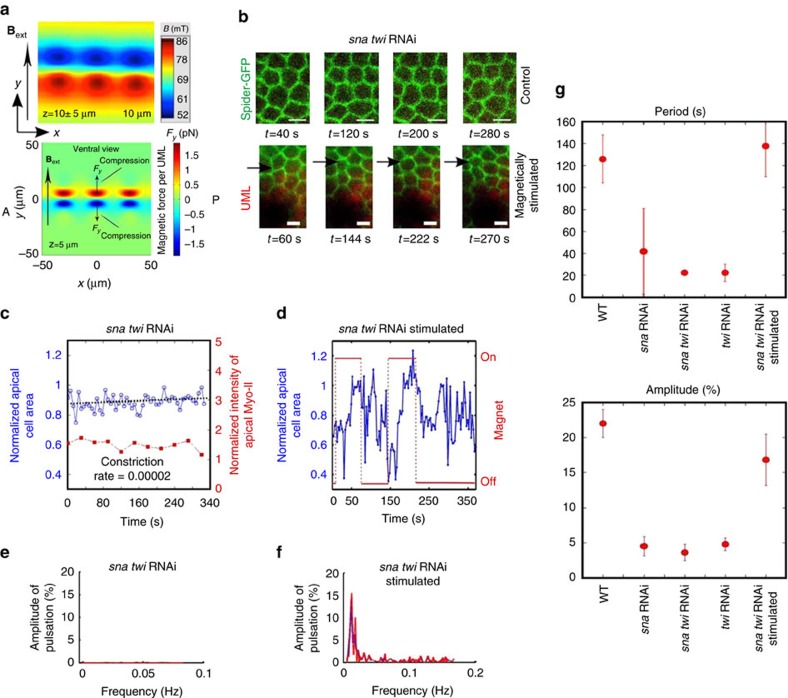
Figure 2. Mimicking of sna-dependent apex pulsations in mesoderm cells.
(a) Up: ventral view of the magnetic field measured on the apical surface of mesoderm cells. Quantitative estimate of the stray field produced in the vicinity of the micro-magnets, measured by scanning hall probe microscopy (probe tilted by 23°) at a distance of 10±5 μm above the micro-magnets. Bottom: ventral view of the magnetic force Fy on the apex of the mesoderm cells. Simulation of the in-plane (y component) magnetic force experienced by an UML positioned in the plane 5 μm above the micro-magnets. (b) Magnetic stimulation of apex pulsations by the application of a pulsed magnetic field to micro-magnets (shadowy object at bottom of images) positioned close to UML-loaded mesoderm cells on sna twi spider–GFP embryos. Green corresponds to Gilgamesh and red to UML. (c) Variation of the apical surface (in blue) and Myo-II concentration (in red) as a function of time in the sna twi RNAi. Representative of the n=11 quantified cells of the N=745 cells observed in six distinct embryos. (d) Variation of the apical surface area (in blue) of cell pulsations induced by the application of a pulsed magnetic field to micro-magnets positioned close to UML-loaded mesoderm cells, in sna twi RNAi. Representative of the n=12 quantified cells of the 71 pulsating cells on the N=726 cells observed in six distinct embryos. (e) Spectral signature of apex surface area fluctuations in the mesoderm cells of sna twi RNAi embryos. Representative of the n=3 quantified cells of the N=745 cells observed in six distinct embryos. (f) Spectral signature of magnetically induced apex surface pulsations in the mesoderm cells of sna twi RNAi embryos. Representative of the n=12 quantified cells of the 55 pulsating cells on the N=596 cells observed in five distinct embryos. (g) Period and amplitude of mesoderm cell apex pulsations in the WT, versus sna RNAi (Pper=0.006, Pamp=0.002), sna twi RNAi (Pper=0.01, Pamp=0.01), twi RNAi (Pper=0.007, Pamp=0.002), consistently repressing the pulsating effects of its sna target gene in the presumable case twi RNAi is efficient enough, and sna twi RNAi magnetically stimulated (Pper=0.4, Pamp=0.005), and sna twi RNAi versus sna twi RNAi magnetically stimulated embryos (Pper=0.013, Pamp=0.011). P values are calculated from the Mann–Whitney test, and error bars are s.d.

