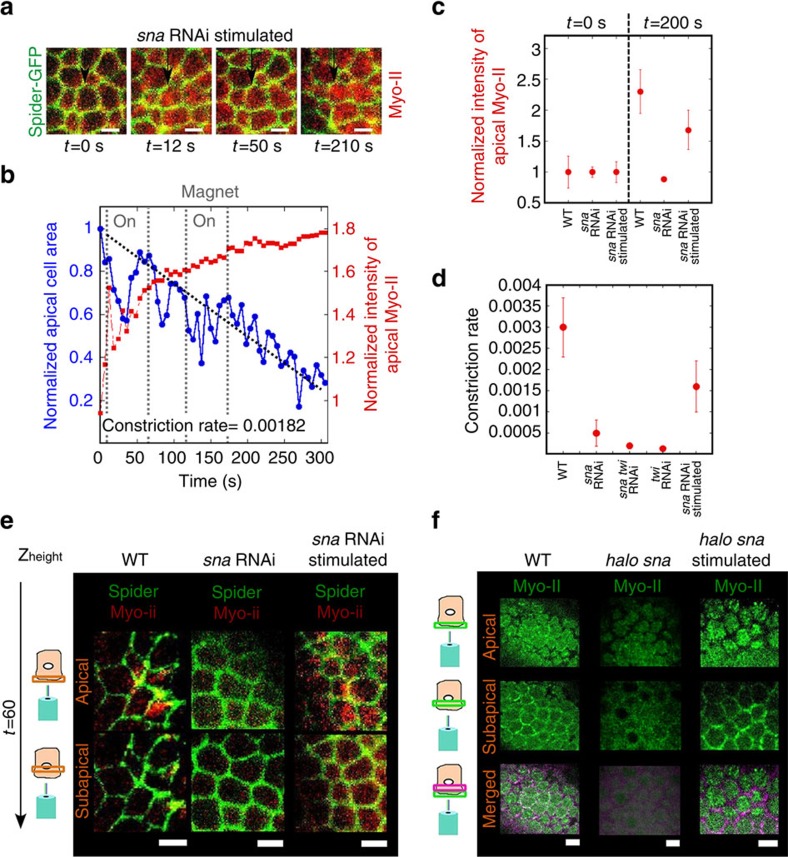
Figure 3. Rescue of medio-apical Myo-II in sna-defective embryos by mechanical pulses.
(a) Dynamical imaging of apex size (Spider, Gilgamesh in green) and accumulation of Myo-II (1 μm below, merged in red) in snaRNAi-injected embryos in magnetically stimulated embryos mimicking sna-dependent pulsations in mesoderm cells. Representative of n=3 of the N=5 embryos (P=0.015, exact Fisher test). (b) Quantification on one representative cell of a. (c) Quantification of the apical accumulation of Myo-II at 200 s compared with 0 s in the WT, sna RNAi and sna RNAi magnetically stimulated. N=6 embryos for each condition (P<10−3 for both sna RNAi versus WT and sna RNAi magnetically stimulated). (d) Constriction rate in WT (N=6), versus sna RNAi-injected (N=6, P=0.004), sna RNAi twi RNAi-injected (N=6, P=0.02), twi RNAi (P=0.002) and sna RNAi magnetically stimulated (N=4, P=0.03) embryos. Scale bars, 5 μm. P values are calculated from the Mann–Whitney test, and error bars are s.e. (e) Spider (Gilgamesh, in green) and Myo-II (in red) cortical submembrane and junctional apical locations in the mesoderm cells of WT, sna RNAi and sna RNAi magnetically stimulated embryos, at t=100s. (f) Myo-II (in green) cortical submembranar and junctional apical locations in the mesoderm cells of WT, halo sna and halo sna magnetically stimulated embryos, at t=100 s. Representative of n=8, n=8 (P<10−3, exact Fisher test) and n=6 embryos (P=7 × 10⁻³) respectively, of the N=8 embryos observed in each case.

