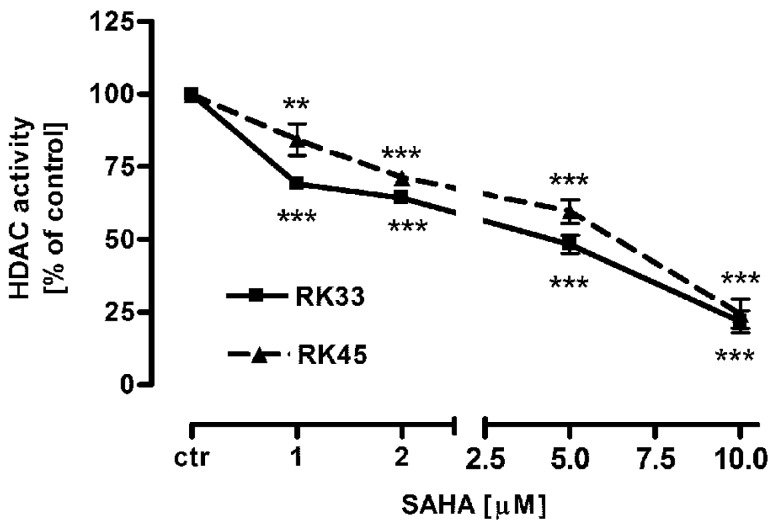
Figure 1.
Intracellular HDACs activity in larynx cancer cell lines after treatment with either culture medium alone (control), or SAHA (1-10 µM) for 6 hours. Data are presented as mean ± SEM at each concentration. (**p<0.01; ***p<0.001 by Student's t-test); (***p<0.001 by analysis of variance ANOVA test); n=9 per concentration from three independent experiments.

