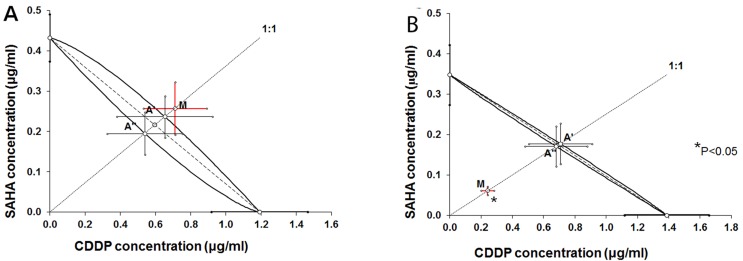
Figure 5.
Isobolograms illustrating types of interactions between cisplatin (CDDP) and suberoylanilide hydroxamic acid (SAHA) with respect to their anti-proliferative effects in the RK33 (A) and RK45 (B) larynx cancer cell lines measured in vitro by the MTT assay. The IC50 ± S.E.M. of CDDP and SAHA are plotted graphically on the X- and Y-axes, respectively. The lower and upper isoboles of additivity represent the curves connecting the IC50 values. The dotted line originating from the point (0, 0) corresponds to the fixed-ratio of 1:1 for the combination of CDDP with SAHA. Points A' and A” correspond to the theoretically calculated IC50 add values for both, lower and upper isoboles of additivity. The point M illustrates the experimentally determined IC50 mix value producing a 50% anti-proliferative effect in two cancer cell lines; RK33 (A) and RK45 (B). The S.E.M. values are presented on each graph as horizontal and vertical error bars for every IC50 value. The experimentally-derived IC50 mix value is placed close to the point A', indicating additive interaction between CDDP and SAHA in the cancer cell line RK33 (A), whereas in the cancer cell line RK45 (B), the IC50 mix value is placed significantly (P<0.05) below the point A”, indicating supra-additive (synergistic) interaction between CDDP and SAHA.

