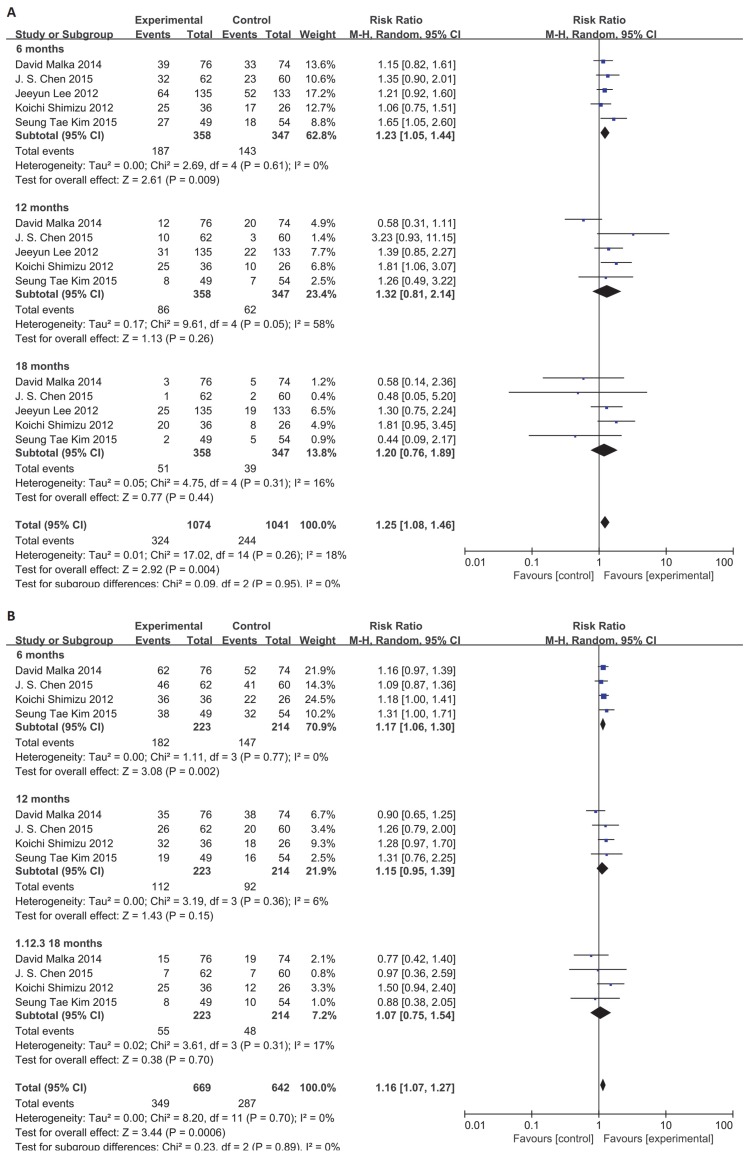
Figure 4.
Subgroup analysis of 6, 12, 18-month PFS and OS. Random effects model (Mantel-Haenszel method) was used here. Each trial is represented by a square, the center of which gives the risk ratio (RR) for that trial. The black diamond gives the overall RR for the combined results of all trials. The Cochran's Q test (Chi2) was applied to evaluate whether the results of the studies were homogeneous. All the heterogeneity was evaluated by inconsistency index (I2). The overall effect was estimated by P-value. A p-value of less than 0.05 is considered to be statistically significant. Subgroup analysis was performed to this meta-analysis according to 6-month, 12-month and 18-month. (A) Analysis of 6-, 12- and 18-month PFS. (B) Analysis of 6-, 12- and 18-month OS.

