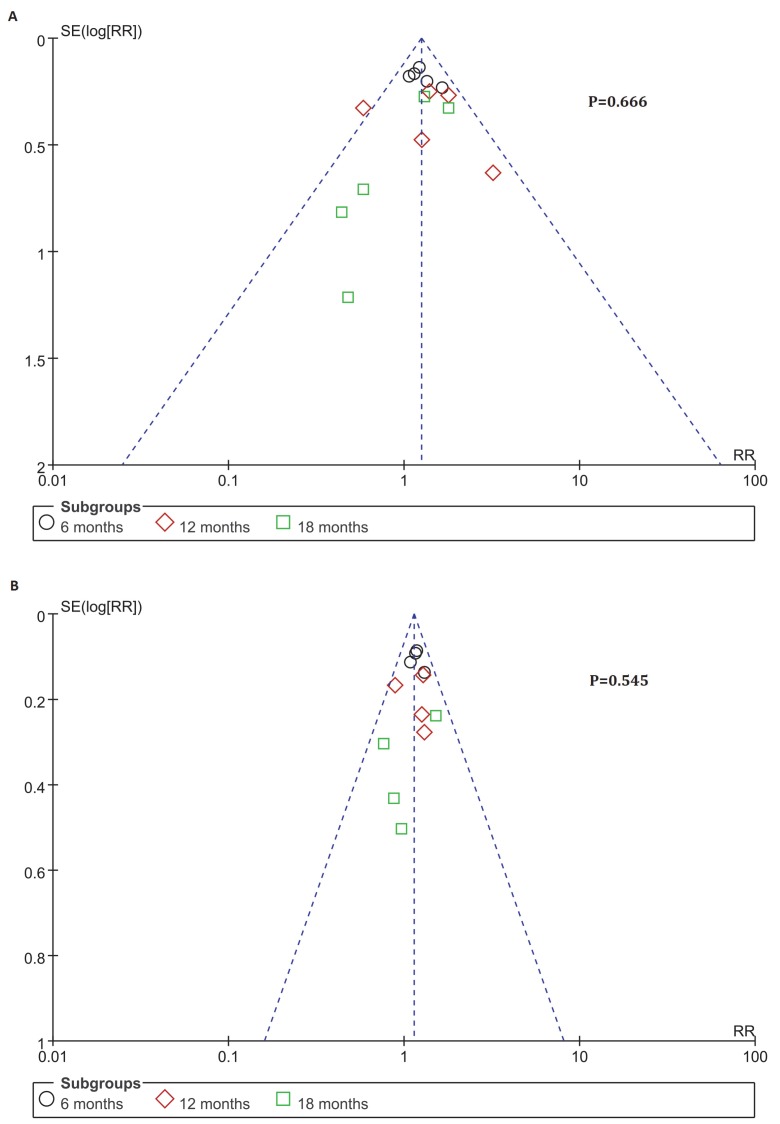
Figure 5.
Funnel plots of PFS and OS. Publication bias was assessed by the funnel plots. The X-axis was risk ratio (RR), and the y-axis represents the standard error (SE, log risk ratio). No publication bias was found using Egger's test (P=0.666, P=0.545) via R platform. Each study was divided into three sub-groups which represented by a different type of dot (black circle: 6-month, red diamond: 12-month, green square: 18-month). (A) Analysis of 6-, 12- and 18-month PFS. (B) Analysis of 6-, 12- and 18-month OS.

