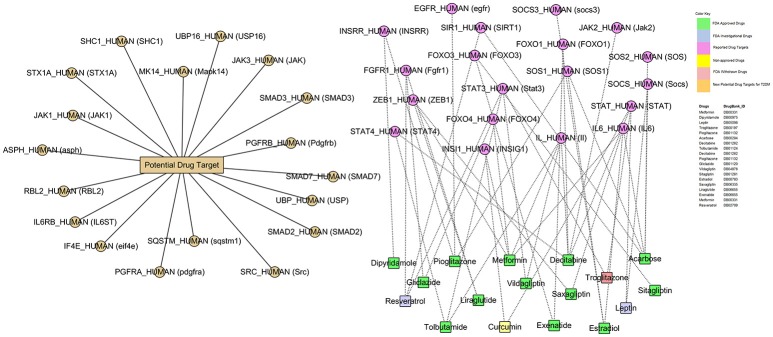
Figure 10.
Drug–Gene network (DG-network). The DG-network is generated between the reported drugs and their target gene signatures (55-nodes and 63-edges). Circles and rectangles correspond to target genes and drugs, respectively. A dotted link is placed between a drug and a target node if the gene is a known target of that drug while solid link denotes the potential drug targets. Color codes are given in the legend. DrugBank_ID has been shown for these drugs. The drugs-gene signature assocaition was curated using PMC, CTD, and Drug Bank databases.

