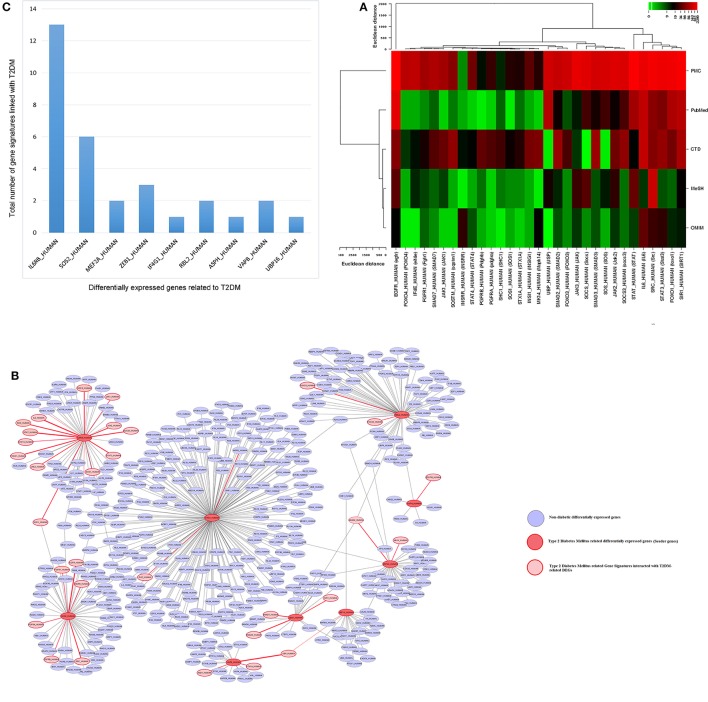
Figure 7.
Molecular Sub-network analysis (A) gene Mapping and role of gene signatures in T2DM was curated and counted in CTD, PMC, PubMed, OMIM, and MeSH databases (B) molecular sub-network (462 nodes and 457 edges) of T2DM-related differentially expressed seeder genes interacted with T2DM-related gene signatures. The interaction is highlighed with red color (C) total number of gene signatures associated with each T2DM-related differentially expressed seeder genes.

