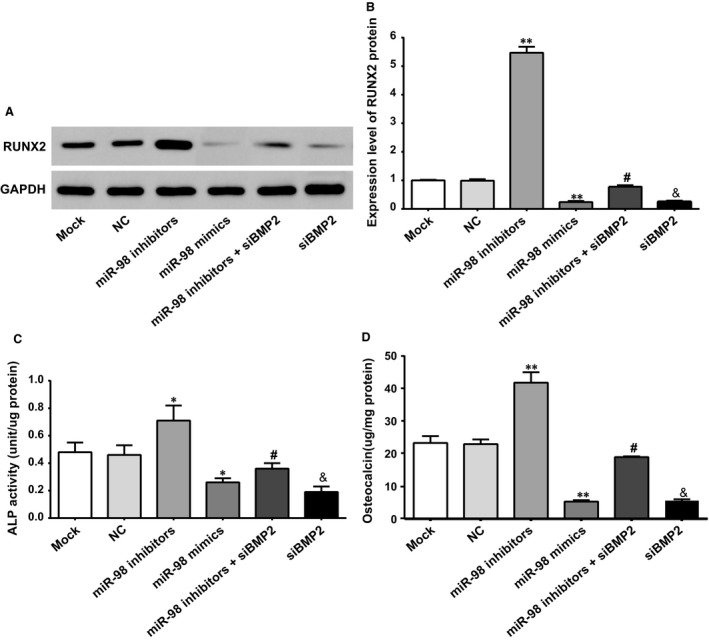
Figure 7.

Levels of osteogenic markers in each group of cells. (A) The protein expression of RUNX2 in each group of cells; (B) ALP activity in each group of cells; (C) OC content in each group of cells; * represented the P‐value less than 0.05 compared with the Mock group and NC group; ** represented the P‐value less than 0.01 compared with the Mock group and NC group; # represented the P‐value less than 0.05 compared with the miR‐98 inhibitors group; & represented the P‐value less than 0.05 compared with the miR‐98 inhibitors + siBMP2 group. ALP: alkaline phosphatase; NC: negative control.
