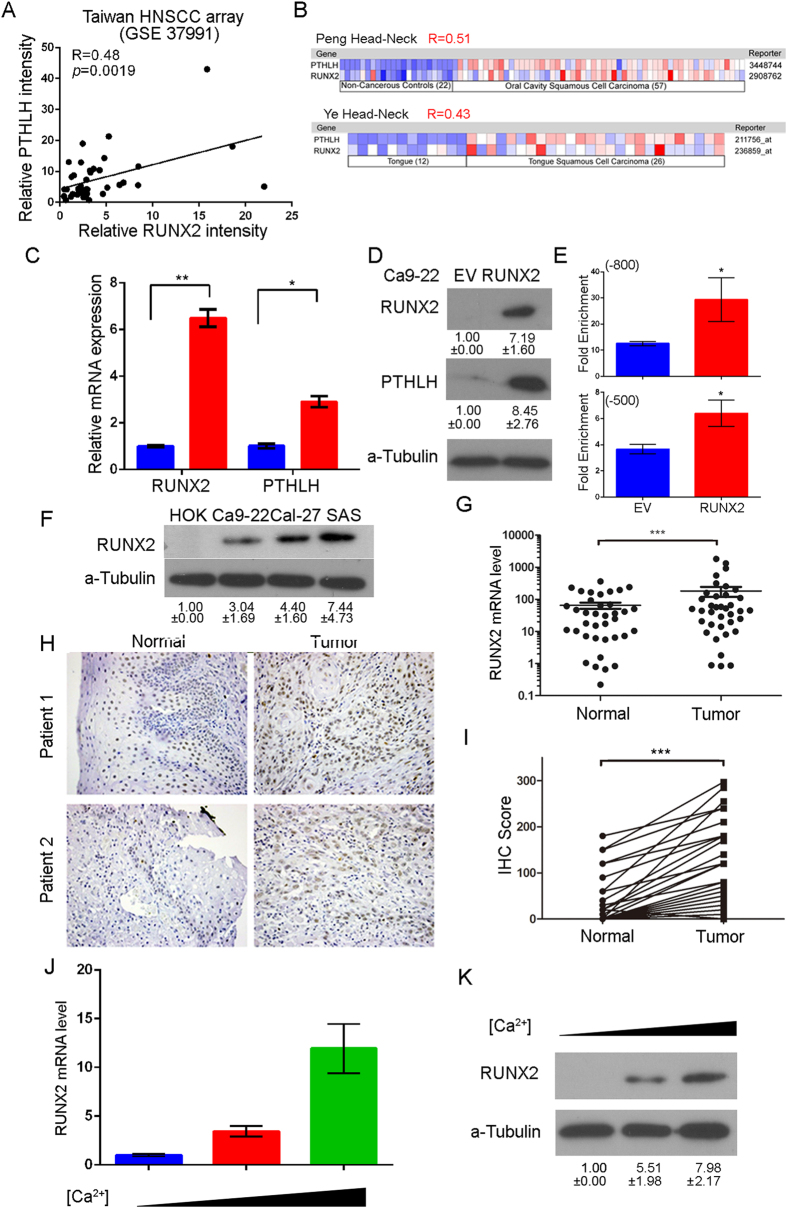
Figure 3. RUNX2 regulates PTHLH expression and RUNX2 is overexpressed in HNSCC tumor.
(A) The mRNA expression correlation between RUNX2 and PTHLH in Taiwanese HNSCC microarray database (GSE37991) (B) The mRNA expression correlation between RUNX2 and PTHLH in HNSCC from the Oncomine™ database. The Pearson’s Correlation test was used to evaluate the statistical significance of correlation between RUNX2 and PTHLH expression. (C and D) PTHLH mRNA (C), cellular protein (D) expression after the enforced expression of ectopic RUNX2 in Ca9-22 cells. The RUNX2 band was cropped from Supplementary Figure 5B at 55 kDa region. (E) RUNX2 ChIP-qPCR results on −800 bp and −500 bp RUNX2 binding regions of PTHLH promoter in Ca9-22 cells after enforced expression of ectopic RUNX2. (F) RUNX2 expression among HOK and HNSCC cell lines was analyzed by Western blotting (Supplementary Figure 5C). (G) RUNX2 mRNA levels in in 45 paired adjacent normal tissues and tumor tissues from HNSCC patients. RUNX2 protein levels in 40 paired adjacent normal tissues and tumor tissues from HNSCC patients. (H) Representative images from IHC staining of RUNX2 from paired HNSCC tissues. (I) The quantification of IHC results of RUNX2 IHC. (J and K) The RUNX2 mRNA (J) and protein (K, Supplementary Figure 5D) expression after exposure to different concentration calcium cation (1.8, 2.4, and 3.0 mM). In (C,E,G,I and J) data from three independent experiments were presented as mean ± SEM. The statistical significance was analyzed by Student t-test. (*p < 0.05; **p < 0.01; ***p < 0.001).

