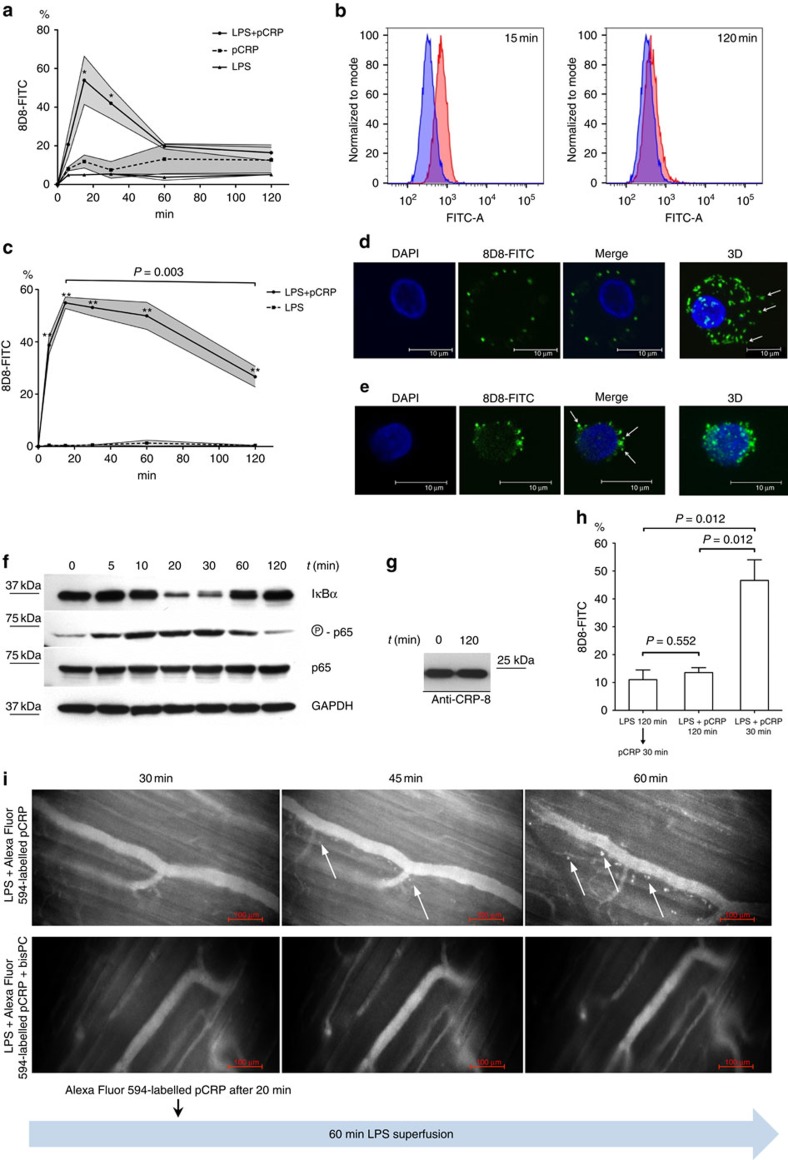
Figure 1. pCRP binds to activated monocytes.
(a) THP-1 cells were incubated with LPS. Where indicated pCRP (100 μg ml−1) was added simultaneously with LPS. Cells were stained with anti-pCRP-8D8/FITC. Fluorescence was recorded by flow cytometry. *P value<0.05 compared to resting cells (paired t-test). Shaded areas display the s.e.m. (n≥3 for each group and time point). (b) Representative fluorograms of LPS-stimulated THP-1 cells in the presence of pCRP at t=0 (blue curves) and at indicated time points (red curves). (c) pCRP binding to human monocytes was analysed as in (a). **P value <0.01 (paired t-test). Displayed are means±s.e.m. (n=3 for each group and time point). Shaded areas define the s.e.m. (d) Confocal fluorescence microscopy of LPS-activated human monocytes in the presence of pCRP. Depicted is a plane from the centre of the cell and a 3D reconstruction of the whole cell. The nucleus was stained with DAPI (blue) and pCRP with anti-pCRP-8D8/FITC (green). pCRP localizes in clusters on the plasma membrane. pCRP–microvesicle complexes separate from the membrane (arrows). Scale bars, 10 μm. (e) Confocal fluorescence microscopy of LPS-activated THP-1 cells. Cells were treated as in (d). Scale bars, 10 μm. (f) Western blot of NF-κB pathway screen of LPS-activated THP-1 cells. Cells were incubated for indicated time periods with LPS, lysed and separated on SDS–PAGE. Uncropped images of western blots are shown in Supplementary Fig. 12. (g) Western blot of cell-free supernatants after incubation of THP-1 cells with LPS and pCRP for indicated time periods. CRP was detected after separation on SDS–PAGE, which induced dissociation of the pentamer. The detected size thus corresponds to a CRP monomer (23 kDa). (h) pCRP binding to THP-1 cells. Cells were treated as described under (a); however, one sample was simultaneously incubated with pCRP and LPS for 120 min, whereas the other sample was first incubated with LPS for 120 min and only then with pCRP for 30 min. Bars indicate mean±s.e.m. P values were calculated with a paired t-test (n=3). (i) In vivo visualization of the pCRP–leukocyte interaction. Rat cremasteric muscle tissue was stimulated via superfusion with 1 μg ml−1 LPS. Alexa Fluor 594-labelled pCRP (25 μg ml−1 serum concentration) or pCRP preincubated with 1,6-bis-PC (bisPC) was added 20 min later. At t=45 min binding of pCRP to transmigrated leukocytes can be observed (arrows). In the presence of 1,6-bis-PC, labelled pCRP can be seen in the microcirculation, but not on transmigrating leukocytes. Scale bars, 100 μm.

