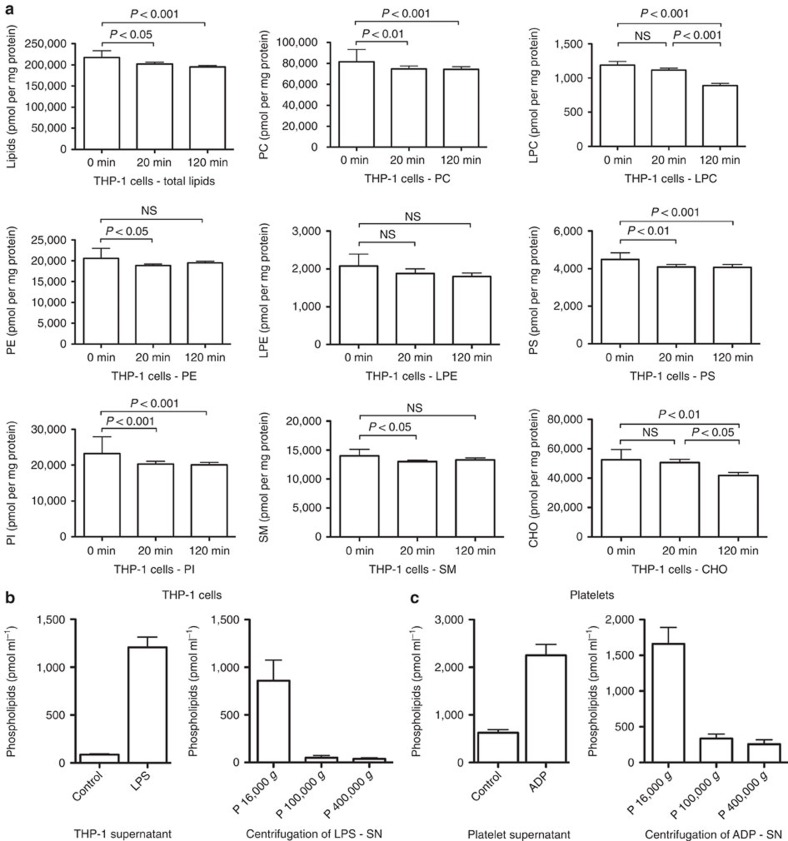
Figure 2. LPS-activated THP-1 cells release microvesicles.
THP-1 cells were stimulated with LPS for indicated time periods. Total lipids were extracted and subjected to mass spectrometric analysis. (a) THP-1 cells lost significant amounts of lipids after LPS stimulation. Most lipids decreased significantly over time, with LPC and CHO showing the most distinctive decline, which occurred between 20 and 120 min after stimulation. Lipid values are expressed as pmol per mg protein. Other lipids identified were: LPE, phosphatidylcholine (PC), PE, PI, PS and SMs (n=12). P values were calculated with one-way analysis of variance (ANOVA). (b) Lipid concentrations in the 1,500 g supernatant of LPS stimulated and resting THP-1 cells were determined by mass spectrometric analysis (n=6). The 1,500 g supernatant after LPS stimulation was further separated by differential centrifugation. Microvesicles were collected at 16,000 g, and smaller microvesicles pelleted at 100,000 g and 400,000 g. Displayed lipid values are expressed as pmol ml−1 supernatant (SN) and the s.d. (n=6). (c) Lipid concentrations in the 1,500 g supernatant of ADP-stimulated and resting platelets (n=2). The 1,500 g supernatant after ADP stimulation was further separated by differential centrifugation as described in (b). Displayed lipid values are expressed in pmol ml−1 supernatant±s.d. (n=2).

