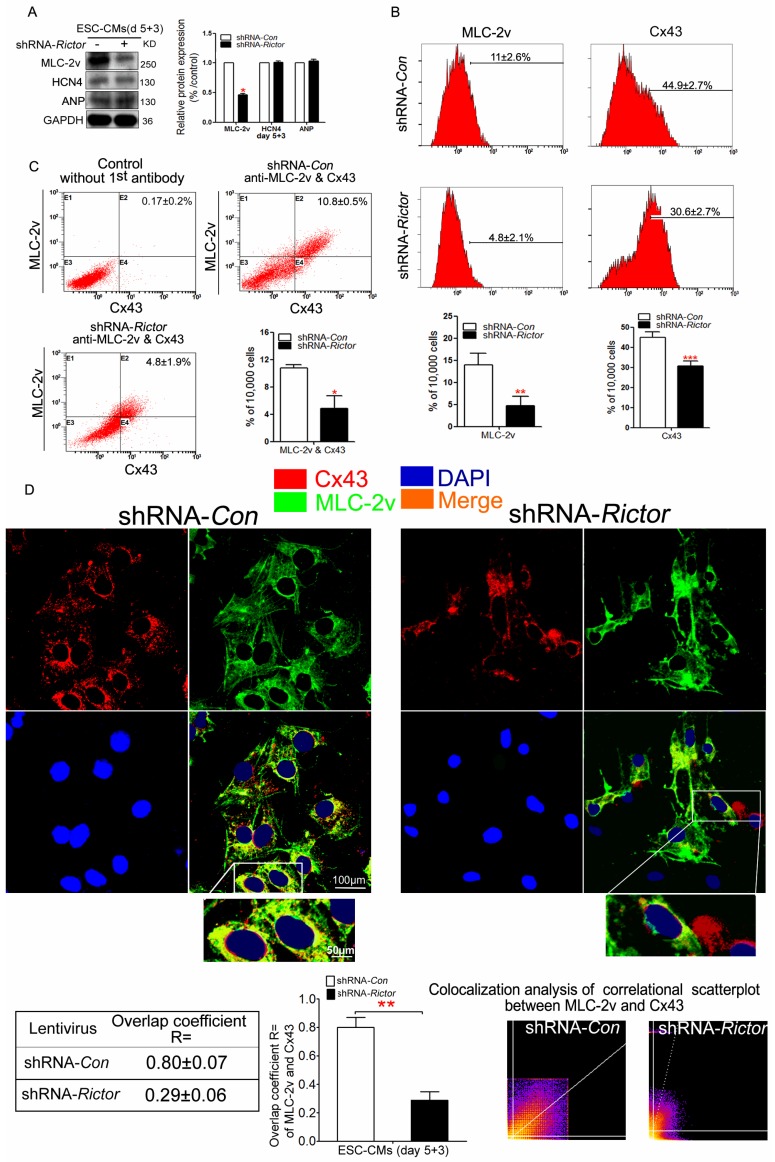
Figure 3.
Effects of Rictor/mTORC2 knockdown on the formation of ventricular-like cells and the expressions of MLC-2v and Cx43. (A) Western blot analysis indicated that shRNA-Rictor inhibited the expression of ventricular-specific MLC-2v, while the expression of HCN4 and ANP were not changed in mESC-CMs. (B) Flow cytometry analysis showed that the expressions of MLC-2v or Cx43 were reduced in shRNA-Rictor cells isolated from day 5+3 EBs. Representative histogram and the statistics analyses were shown. (C) Quantification of MLC-2v and Cx43 co-expression by flow cytometry. Representative dot blot analyses of MLC-2v and Cx43 co-expression were shown. The X-axis corresponding to fluorochrome FITC detected at 530 nm, and Y-axis corresponding to fluorochrome PE detected at 575 nm. (D) Analysis of ventricular-specific MLC-2v and Cx43 co-immunostained for MLC-2v (green) and Cx43 (red) on day 5+3. Nuclei were stained with DAPI (blue). The colocalization analysis of correlational scatterplot between MLC-2v and Cx43 were counted. Bar=100 μm or 50 μm. Similar data were obtained from at least 3 independent experiments. Data were shown as means ± SD. *P<0.05, **P <0.01, ***P<0.001 for shRNA-Rictor vs shRNA-Con.

