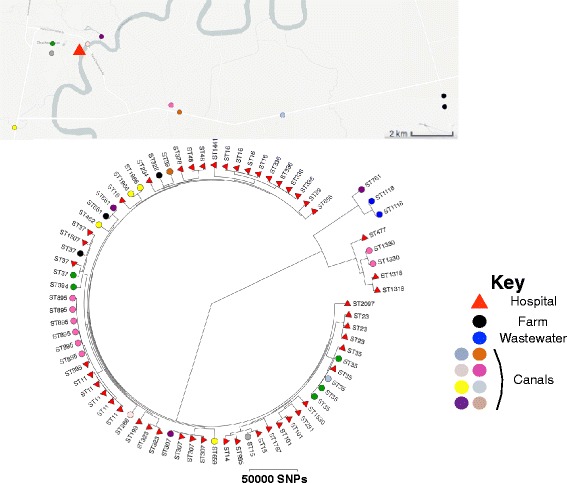
Fig. 1.

Map showing the geographical origin of study isolates. The triangle denotes Bhuddhasothorn Hospital and the maximum likelihood tree for 77 K. pneumoniae isolates from clinical and environmental samples (canals, livestock, and hospital sewage) showing the distribution of STs across the population. Triangle and circles correspond to clinical and environmental isolates, respectively. Wastewater isolates were recovered from the hospital and therefore have the same location as the hospital in the map. An interactive map can be found at www.microreact.org/project/Skog9F1ex
