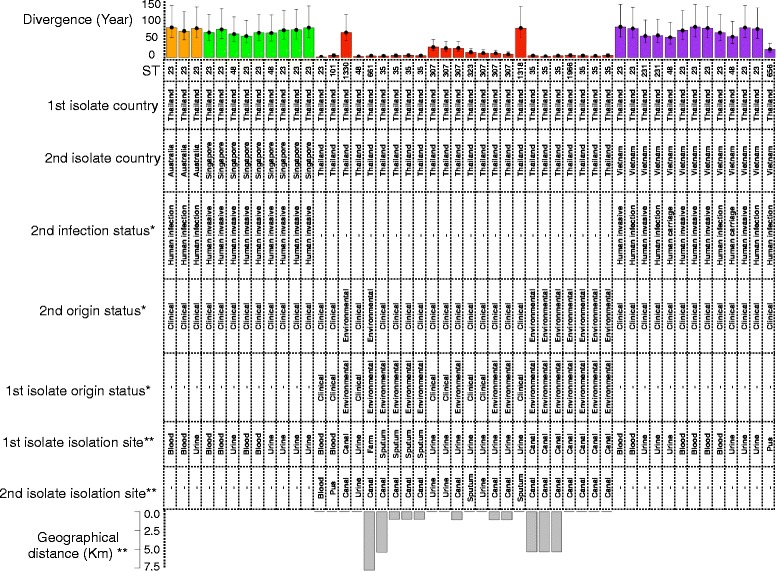
Fig. 4.

Origin, sample type, and isolate features for divergences between a Thai isolate and any other isolate from the Thai or global collection for non-clade 1 and 3 isolates over the past 50 years. This time corresponds to the formation of clade 1. To obtain the age and the upper and lower bounds for the 95% confidence interval, we divided the SNP distance by the mean substitution rates of clades 1 and 3 and the means of the lower and upper values for the 95 confidence intervals of the substitution rates estimated for clades 1 and 3. Each color corresponds to one country. The symbols ** and * signify the specific features of the Thai and the global collection, respectively. The lower bar plot shows geographical distance for Thai isolate pairs
