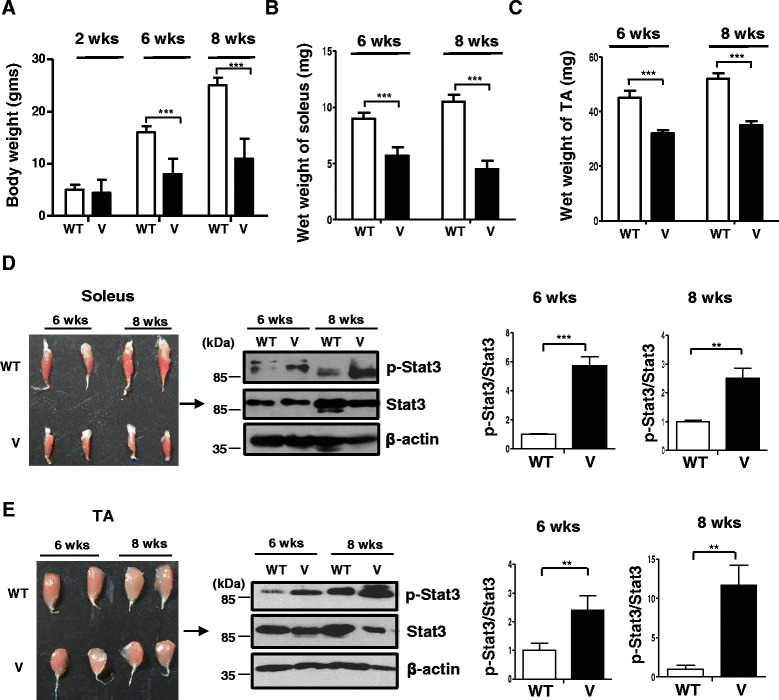
Fig. 1.

Reduced weight and elevated p-Stat3 levels displayed by VDR−/− muscles. Graph shows average weights of the whole body of wild-type (W) and VDR−/− mice (V) at 2, 6, and 8 weeks of age (a) of the soleus (b) and TA muscles (c) that were dissected out from WT and V mice at 6 and 8 weeks (n = 6) (**p < 0.01, ***p < 0.005). d Left panel shows dissected soleus muscles from wild-type (WT) (top row) and VDR−/− mice (V) (bottom row) at 6 and 8 weeks of age. Right panel shows a representative western blot analysis of the lysates from the same subset of muscles from WT and V and probed for p-Stat3 antibody (top panel) and total Stat3 (middle panel). Graphs to the right show quantitative analyses of replicative blots of the ratio of relative intensities of p-Stat3 to total Stat3 at 6 and 8 weeks, respectively, between WT and V muscles (n = 6) (**p < 0.01). e Left panel shows dissected tibialis anterior (TA) muscles from WT (top row) and V mice (bottom row) at 6 weeks and 2 months of age. Right panel shows a representative western blot analysis of lysates from the same subset of muscles from WT and V and probed with antibodies as in d. Graphs to the right show similar analyses as d of ratios of p-Stat3 to total Stat3 at 6 and 8 weeks, respectively, between WT and V muscles (n = 6) (***p < 0.005). Total Stat3 levels were first normalized to β-actin that serves as a loading control prior to normalization of p-Stat3 to total Stat3
