Fig. 4.

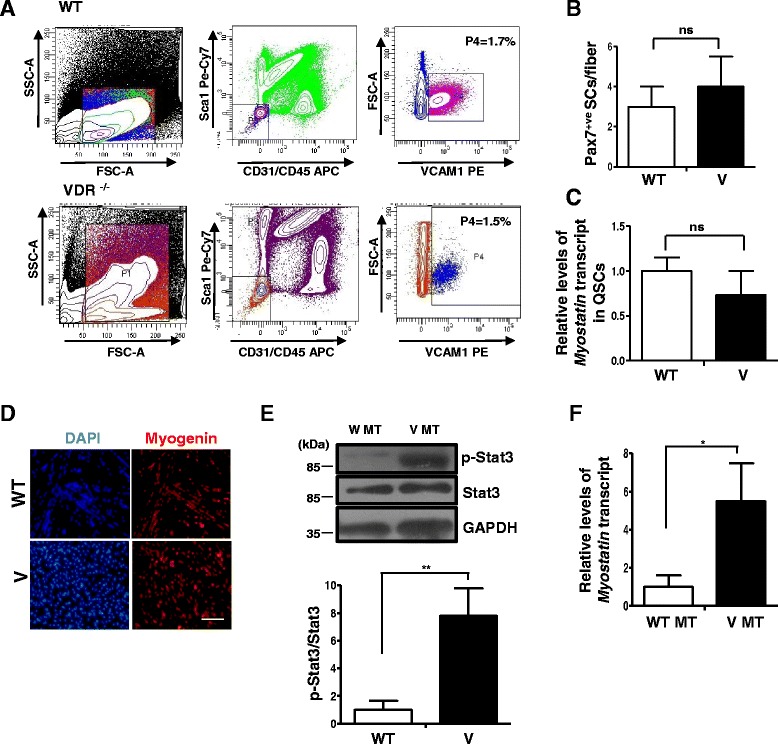
VDR−/− SCs do not differ in number or Myostatin expression from wild-type SCs but display hallmarks of atrophy upon differentiation in culture. a SC numbers were quantified by FACS analysis of mononuclear cells from hind limb muscles of WT and V mice. SCs are shown in purple (WT) and blue (V) in these representative FACS plots. In three replicates, the percentage of SCs in total mononuclear cells in V muscles was not significantly different (1.5%) compared to that in WT muscles (1.7%) (n = 3 mice per genotype were pooled per experiment, N = 3). b Single myofibers were obtained from WT and V muscles and stained for Pax7 to assess SC numbers per fiber. There were no statistically significant differences in the number of SCs per fiber between the two strains. Fibers were obtained from three mice per genotype. c FACS-purified quiescent SCs from WT and V mice muscles were assessed for levels of Myostatin expression by qRT-PCR. Myostatin transcript levels in V are normalized to WT. Quiescent SCs from each genotype represent triplicate experiments of pooled RNA from three mice for each experiment (n = 3 mice per genotype were pooled per experiment, N = 3). d FACS-sorted SCs from WT and V hind limb muscles were induced to differentiate for 2 days and stained for Myogenin. e Western blot analysis of lysates from differentiated SC cultures from WT (WT MT) and V (V MT) mice were probed with p-Stat3 and total Stat3 antibodies. Graph below shows a significant upregulation in p-Stat3 levels in V MT cultures compared to those in WT MT (n = 3 mice per genotype were pooled per experiment, N = 3). (**p < 0.01). f Myotubes from WT and V muscles were assessed for levels Myostatin expression by qRT-PCR. Myostatin is upregulated in V myotubes compared to WT myotubes (*p < 0.05)
