Fig. 5.

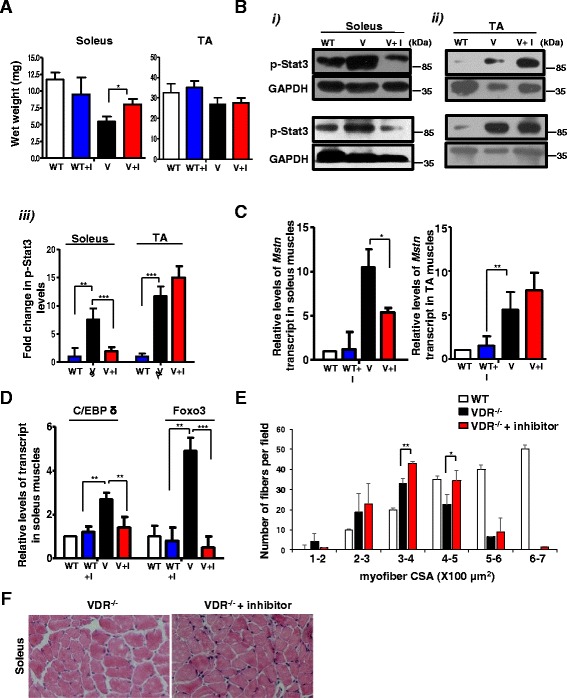
Inhibition of Stat3 activity ameliorates muscle mass loss in VDR−/− soleus muscles. a Average weights of the soleus (left graph) and TA muscles (right graph) from WT and paired V mice that were injected with either the diluent (WT and V, respectively) or C188-9 (WT + I and V + I, respectively) after 2 weeks of treatment (n = 5 mice/group, N = 3 independent experiments). Soleus muscles from V + I mice show a significant increase in weight compared to those from V mice injected with diluent (*p < 0.05). b (i) and (ii) Representative western blot analysis of lysates in duplicate from independent experiments from soleus (i), top and bottom left panels, and TA muscles (ii), top and bottom right panels, from WT, V, and V + I mice. Blots were probed with p-Stat3 antibody. Fold differences in p-Stat3 levels were calculated by normalizing intensities with respective GAPDH values (n = 5 mice/group, N = 3 independent experiments). (iii) Graph shows quantitative analyses of replicative blots of levels of p-Stat3 protein in the TA and soleus muscles after inhibitor treatment (**p < 0.01, ***p < 0.005). A detectable decrease in p-Stat3 levels were observed in soleuses of V + I mice, but not in the TA muscles. c The soleus muscles (left graph) and TA muscles (right graph) from paired V and V + I mice and WT + I mice and were assessed for Myostatin transcript levels by qRT-PCR. There was a significant decline in Myostatin expression in V + I soleus muscles compared to control V muscles, but not in the TA subset of inhibitor-treated V mice (*p < 0.05). d The soleus muscles from same group as c were assessed for C/EBP δ and Foxo3 expression by qRT-PCR. There was a reduction in C/EBP δ and Foxo3 expression in V + I soleus muscles compared to control V muscles (**p < 0.01, ***p < 0.005). e–f Cryosections of the soleus muscles isolated from V (top panel) and V + I (bottom panel) mice were stained for hematoxylin and eosin. Individual fibers were evaluated for cross-sectional area (CSA) in both groups. A minimum of 800 fibers were counted per section from soleuses in three independent experiments for each genotype. V + I soleus fibers show reduced number of smaller fibers of sizes 100–200 μm and a greater homogeneity in fibers with sizes 300–400 μm (S.D = 1.414 for V + I compared to 5.2 for V) (*p < 0.05). There was also a significant increase in fibers with sizes from 400 to 500 μm. Scale bars represent 100 μm
