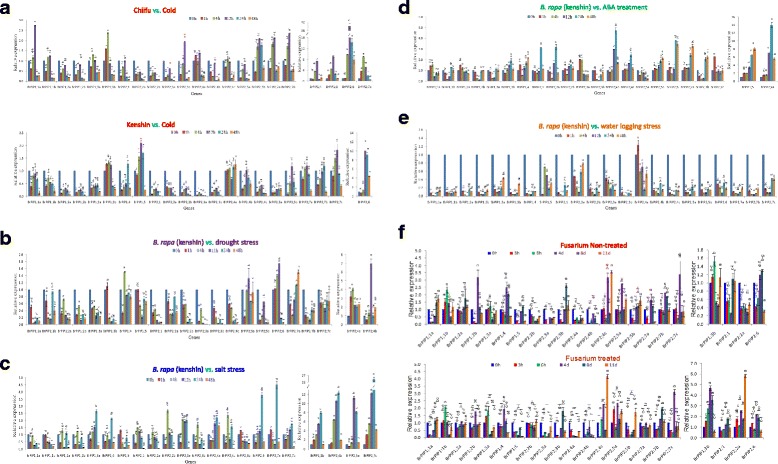
Fig. 6.

Expression analysis of BrPIP genes under abiotic stresses using real-time quantitative RT-PCR. The relative expression levels of BrPIP genes under treatment with (a) cold, (b) drought, (c) salinity (d) ABA (e) waterlogging or (f) Fusarium oxysporum f.sp. conglutinans infection. The error bars represent the standard error of the means of three independent replicates. Variance analysis and the Tukey tests were carried out to determine differences among effects on different time courses due to abiotic and biotic stresses for all genes, where different letters indicate the significant difference with p ≤ 0.05
