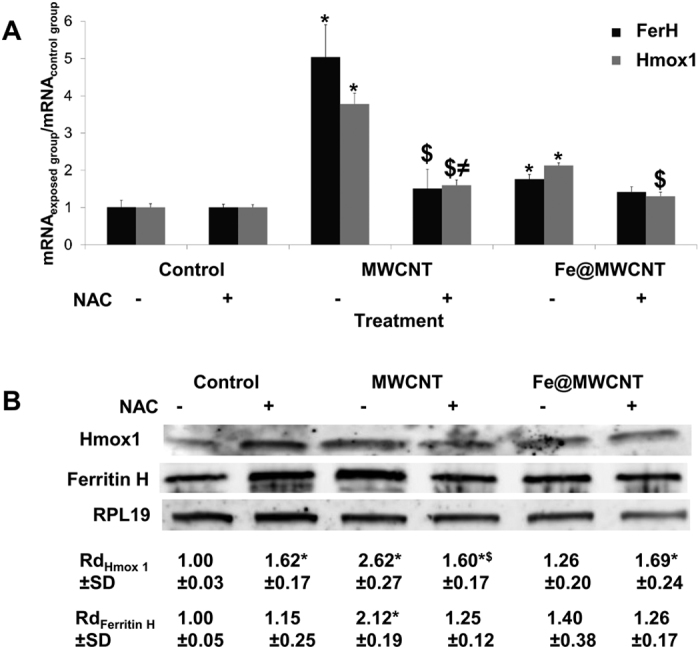
Figure 2. Effect of MWCNTs and Fe@MWCNTs on the gene expression and protein level of FerH and Hmox1 in the presence or absence of NAC.

THP-1 differentiated into macrophages cells were treated with 1 μg/cm2 of MWCNT or Fe@MWCNT suspension in the presence or absence of NAC. After 24 h exposure, (A) mRNA quantification by qPCR or (B) protein level quantification by western blot analysis of FerH and Hmox1 were performed. Results are the mean ± SD of 3 separate experiments. (*) designates a statistically-significant difference from control group (p < 0.05). ($) designates a statistically-significant difference between MWCNT NAC or Fe@MWCNT NAC group and its respective equivalent MWCNT or Fe@MWCNT group without NAC treatment (p < 0.05). (≠) designates a statistically-significant difference between MWCNT NAC or Fe@MWCNT NAC and NAC control group (p < 0.05). Experiments were repeated at least three times with similar observations in each experiment. To improve the clarity, gels were cropped but full-length blots are presented in Supplementary Figure S1.
