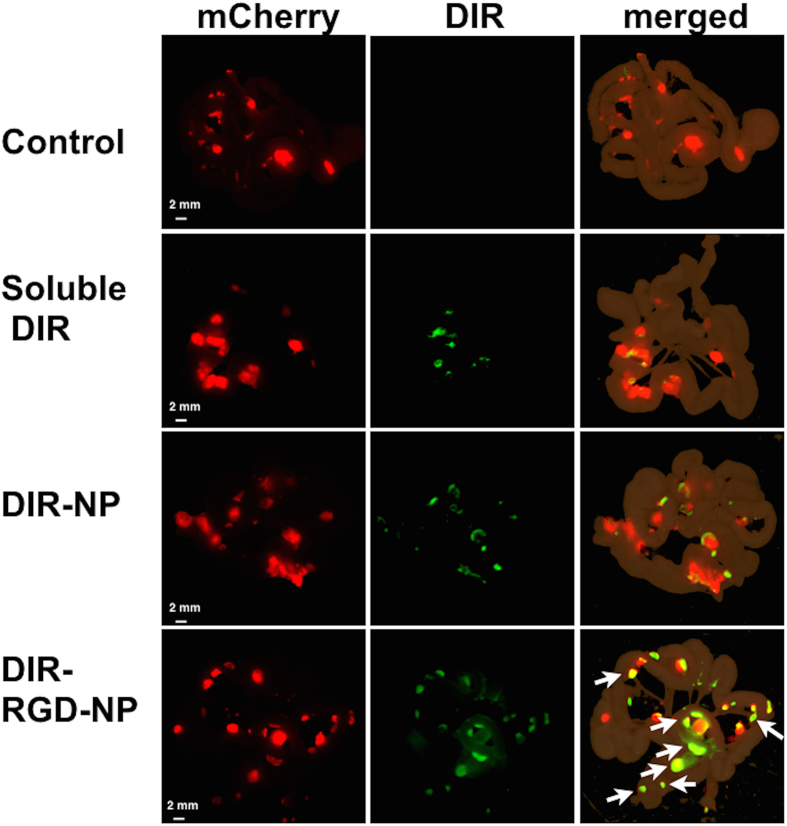
Figure 4. Staining of microtumors with DIR-RGD-NP.
Fluorescence spectral images from dissected intestines and the attached mesentery. Images shown are from mCherry channel (red; left column) and DIR channel (green; middle column). The merged images (right column) demonstrate the best colocalization of mCherry and DIR signals (white arrow) in animals that received DIR-RGD-NP. A representative animal for each delivery system is shown; (n = 4 for soluble DIR and DIR-NP; n = 12 for DIR-RGD-NP).

