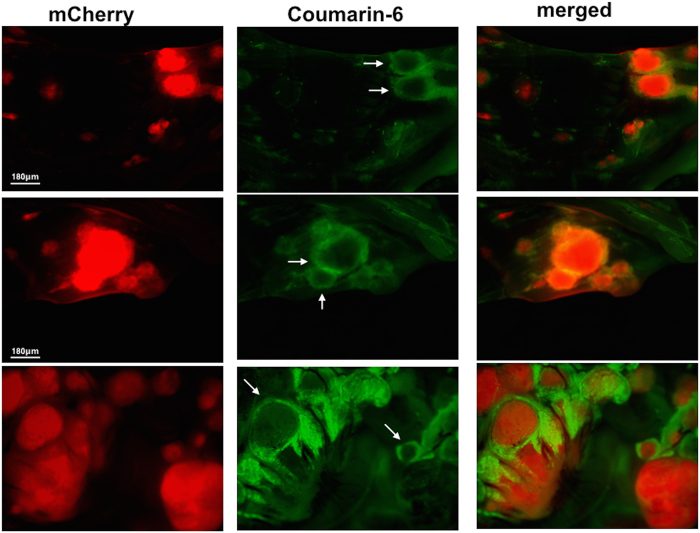
Figure 8. Biodistribution of C6-RGD-NP in the tumor microenvironment.
Upon establishment of tumors (ROI~40,000), mice were given a single dose Cu6-RGD-NP and sacrificed after 2 h (n = 4). Fluorescence imaging demonstrates the spatial relationship between the DIR and mCherry signals; scale bar = 180 μm.

