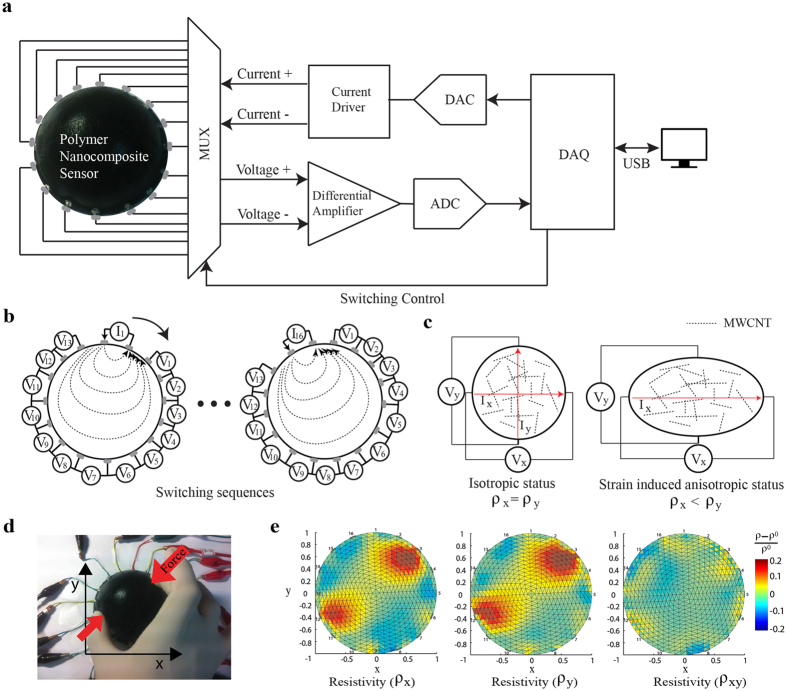
Figure 3. Schematic of electrical impedance tomography and concept of multi-dimensional strain measurements.
(a) Schematic diagram of hardware configurations of electrical impedance tomography53. (b) Schematic of adjacent method injecting electrical current and measuring voltage potentials via multiplexing53. (c) Illustration of the isotropic status and strain induced anisotropic status. (d) Photograph of the test with two fingers and hemispherical shaped MWCNT-silicone elastomer nanocomposites. (e) Results of the test showing two normal resistivities and one shear resistivity.

