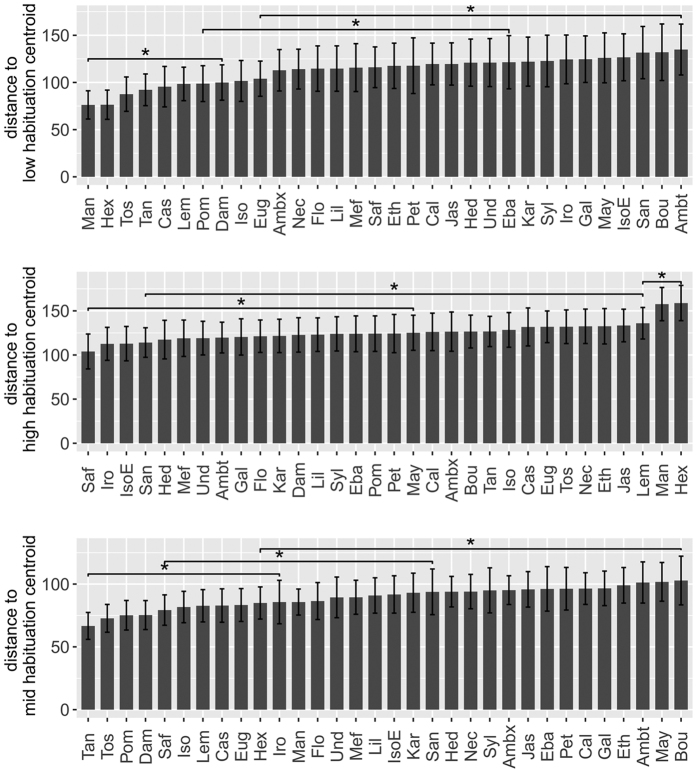
Figure 2. Differences of habituation between odorants.
Habituation is measured as the mean city block distances (±CI95%) to each centroid curve a) low habituation, b) high habituation and c) mid habituation. There were numerous significant differences (Tukey-test fdr corrected) between odorants, 3 examples of the smallest significant differences are shown (*corresponds to p-adj < 0.05).

