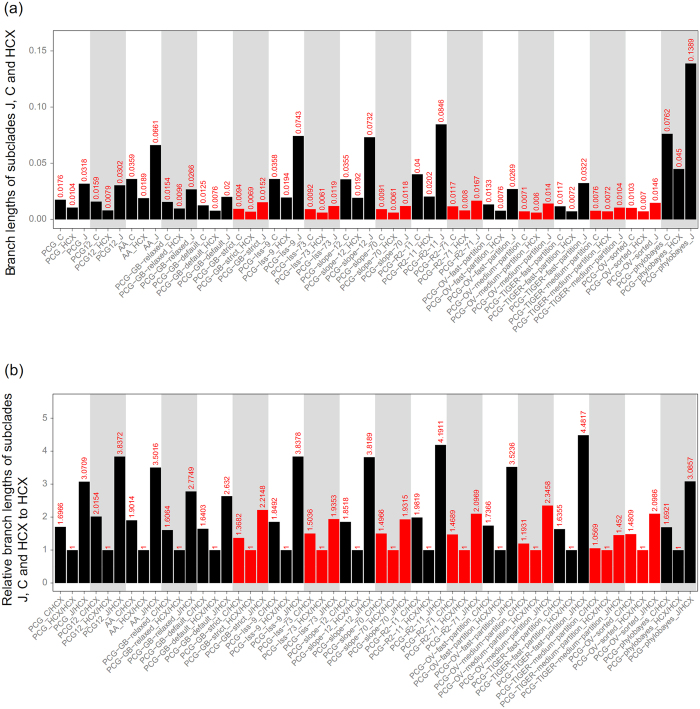
Figure 4. Comparison of branch lengths of subclades J, C and HCX in multiple analyses.
The branch lengths for each of three subclades were calculated from the ML trees shown in Figs 1 and 2 and Supplementary Fig. S1. (a) Branch lengths for each subclade. The numbers above bars are branch length values. (b) Relative branch lengths of subclades J, C and HCX to HCX. The numbers above bars are the branch length ratio for each of three subclades relative to HCX.

