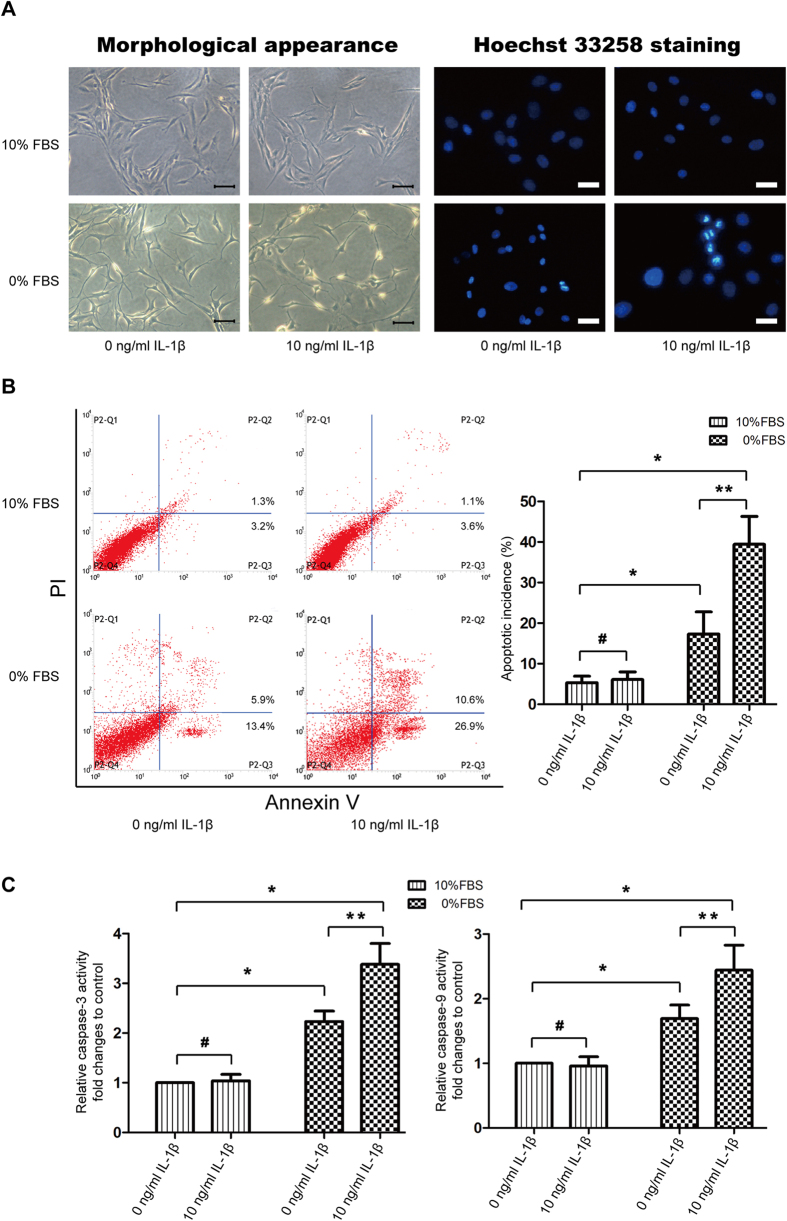
Figure 2. IL-1β induces cell apoptosis under serum deprivation.
(A) Morphologic changes in apoptotic NP cells. Left series is phase-contrast photomicrograph of NP cells and right series is apoptotic nuclei brightly stained by Hoechst 33258. Amplification: 200×. (B) Apoptotic cells were stained with Annexin V-PE and PI, and analyzed by flow cytometry. (C) Caspase-3 and -9 activity were determined by special Caspase Activity Assay Kits. Relative activity of caspase-3 and -9 was represented as fold changes to control (10%FBS + 0 ng/ml IL-1β group). *P < 0.05 and #P > 0.05 Vs. 10% FBS group, **P < 0.05 Vs. 0% FBS group.

