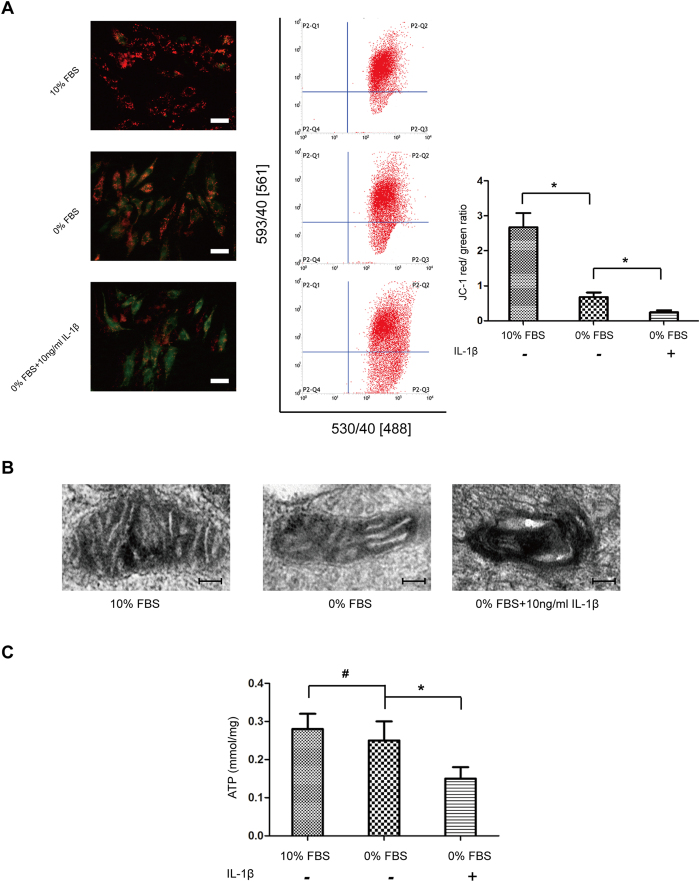
Figure 4. IL-1β stress leads to mitochondrial dysfunction.
(A) The mitochondrial membrane potential was determined by staining with the mitochondrial dye JC-1. The quantitative ΔΨm was expressed as the ratio of red/green fluorescence intensity by flow cytometry. (B) Electron micrographs of mitochondria in NP cells treated with 10% FBS, 0% FBS and 0% FBS + 10 ng/ml IL-1β, respectively. Amplification: 2000×. (C) The intracellular ATP content was performed using an ATP Assay Kit by a microbeta counter. Results were normalized to cellular protein concentration for each sample. Three independent experiments were performed, and data of analysis represents the mean ± SD, *P < 0.05 and #P > 0.05 Vs. 0% FBS group.

