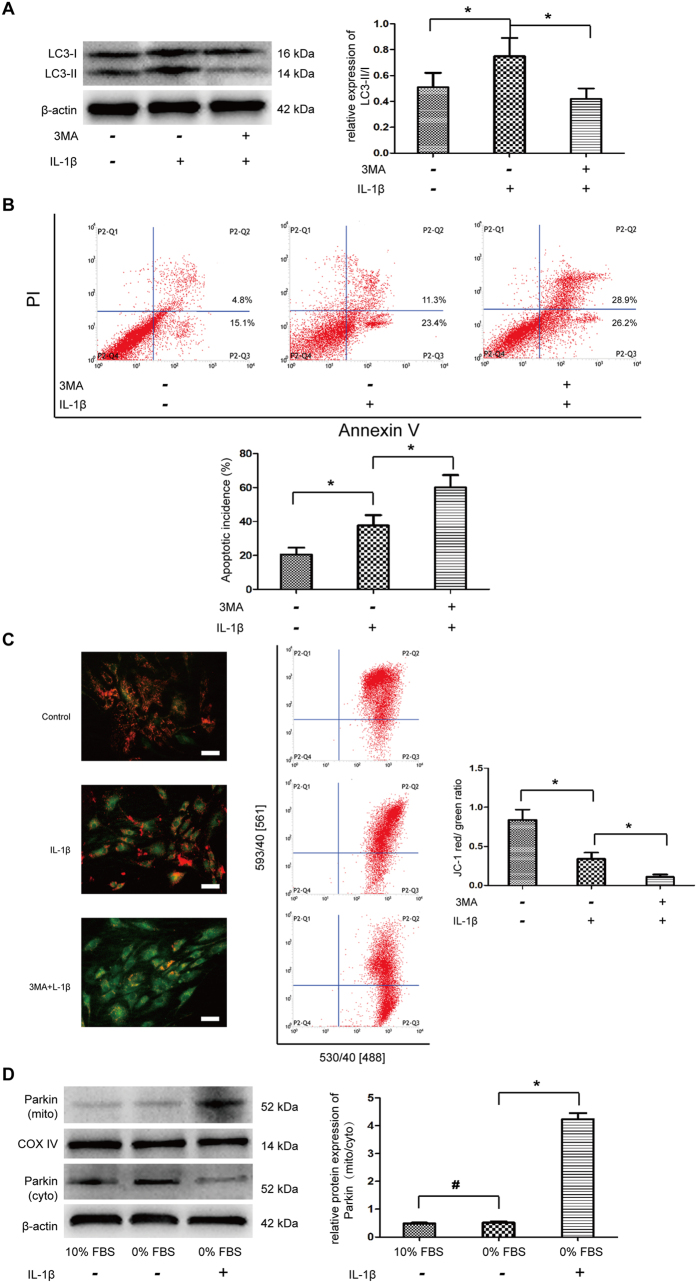
Figure 6. The interactions between apoptosis and autophagy in NP cells under IL-1β stress.
NP cells were pre-treated 3MA for 2 h and then stimulated with IL-1β under serum deprivation. (A) Western blot analysis for LC II/I. (B) Apoptosis incidence quantified by flow cytometry by Annexin V and PI staining. (C) The mitochondria membrane potential was measured by flow cytometry through JC-1 staining. (D) Western blot analysis for the protein expression of Parkin in cytoplasm and mitochondria, respectively. The ratio of Parkin (mito)/Parkin (cyto) was quantified. *P < 0.05 Vs. IL-1β group, and #P > 0.05 Vs. 10% FBS group.

