
Figure 3. Electrostatic potential map comparison of M1-C and M1-A.
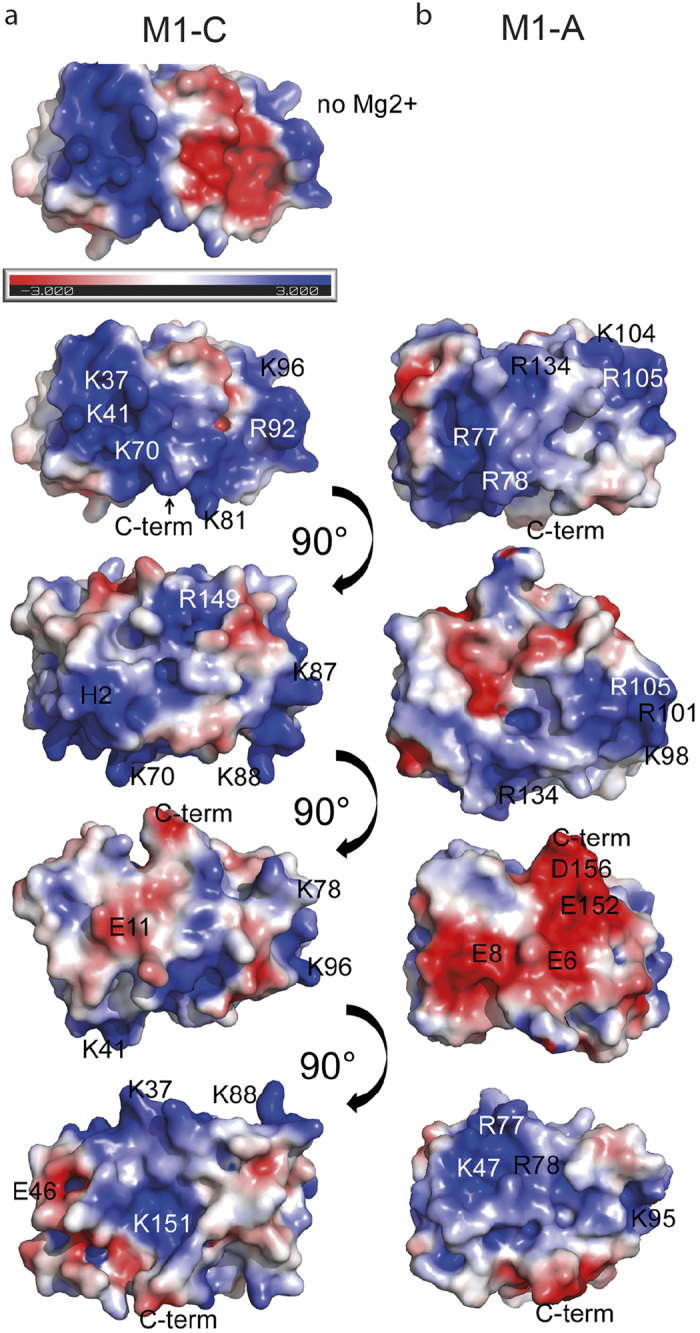
M1 has large basic surfaces. Electrostatic potential map of M1-C (a) compared to the M1-A map (b). The electrostatic potential was calculated from −3.000 KbT/ec (red) to +3.000 KbT/ec (blue).