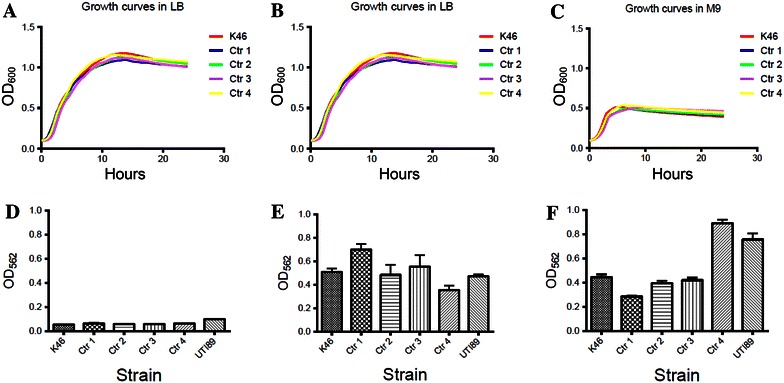
Figure 5.

Growth curves and biofilm formation of E. coli. A–C show representative growth curves in LB, M9, and in YESCA, respectively of E. coli K46 and four control strains (Ctr 1-Ctr 4). D–F show the corresponding biofilm formation, measured relative to the reference strain UTI89. All biofilm data are the mean of three independent experiments performed in quadruplicate. Error bars indicate the standard deviation.
