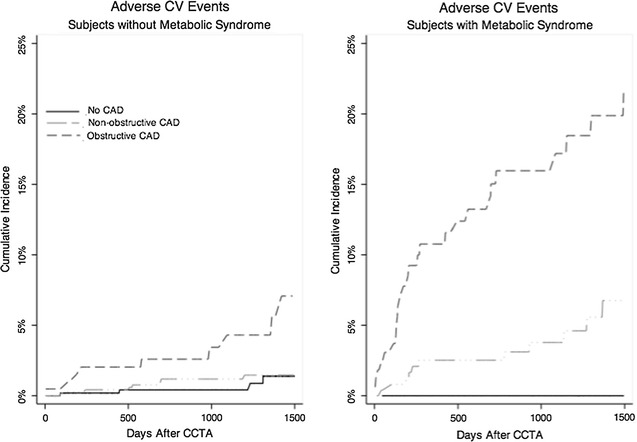
Fig. 4.

Cumulative incidence of adverse cardiovascular (CV) events (CV death, nonfatal MI, unstable angina requiring hospitalization, or coronary revascularization >90 days post-CTA), stratified by no MetS (left panel) and MetS (right panel) and normal CTA versus non-obstructive CAD (short dash line) versus obstructive CAD (long dash). Overall, patients with MetS experienced outcomes over 2× the rate of those without. Those with MetS and obstructive CAD experienced very high adverse events. The left panel was adjusted as in Fig. 3 for BMI, age, gender, current smoking, and hypertension. The right panel was adjusted as in Fig. 3 for BMI, age, gender, and current hypertension
