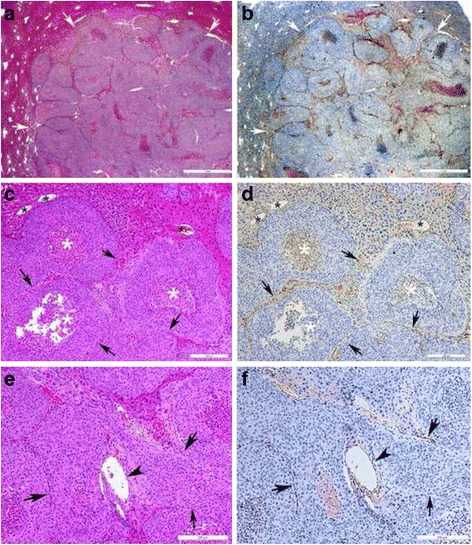
Fig. 7.

Histopathological images of HCCLM3 orthotopic xenograft tumors at 2 weeks. Left: H&E staining. Right: CD34 immunohistochemistry. a b Histopathological images of cancer tissues at week 2. Scale bar = 1 mm. c d Histopathological images of cancer tissues at week 2. Bar = 200 μm. e f Histopathological images of cancer tissues at week 3. Bar = 200 μm. The boundaries between tumor and normal liver tissue could be shown clearly (a and b, white arrow). CD34 expression was positive in the abundant normal hepatic sinusoid (c and d, black asterisks) and tumor angiogenesis (c to f, black arrows and arrow heads). The tumor edge or peripheral vasculature was compressed, having a shift in its curvature. The microvascular-rich regions were diffusely distributed at the edge of tumor nests. New vessels with different diameters were seen. The abnormal large vessels (e and f, black arrow heads) and slit-like small vessels (c to f, black arrows) coexisted. The characteristics of the vascular arrangements in PCI images were partly similar with those of histological sections. In addition, necrosis could be seen in the tumor nest (c and d, white asterisks). The MVD of CD34 expression in tumors was determined by immunohistochemistry. Data are shown as median (Q25, Q75)
