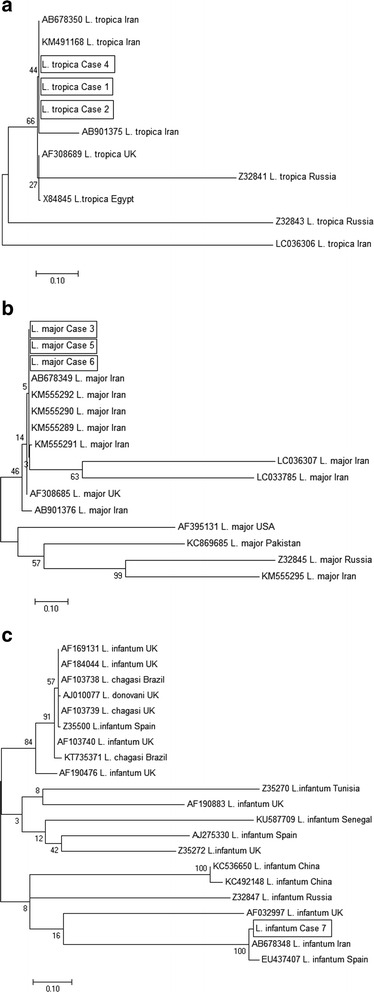
Fig. 4.

a, b, c Phylogenetic relationship among various Leishmania species to each other as inferred by Maximum Likelihood tree based on minicircle kDNA gene. Numbers on branches are percentage bootstrap values of 1,000 replicates. All positions with less than 95% site coverage were eliminated. The evolutionary distances between sequences were computed using the Maximum Composite Likelihood method and are in the units of the number of base substitutions per site. The scale bar indicates an evolutionary distance of 0.10 nucleotides per position in the sequence. The reference sequences accession numbers are inserted. Evolutionary analyses were conducted in MEGA-7
