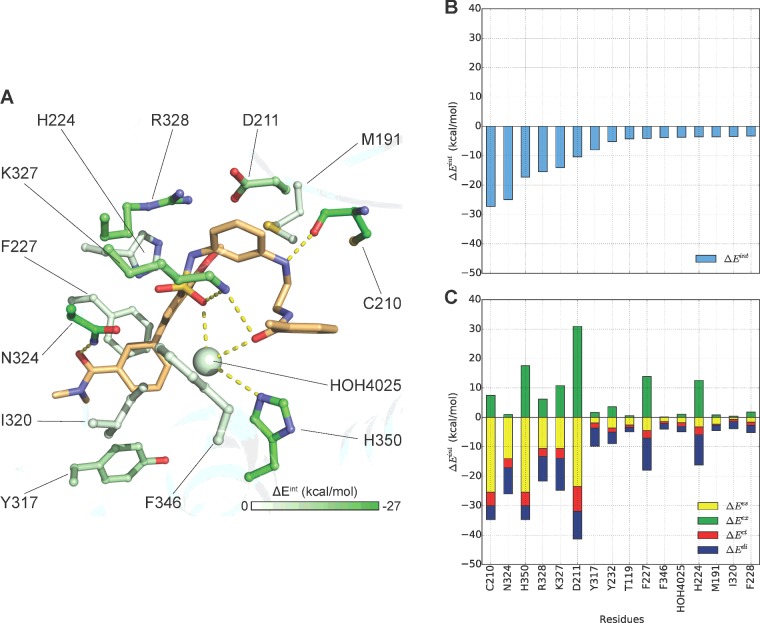
Figure 3. ‘L’-shaped docking pose of compound 26.
FMO results for (A) Literature-like ‘L’ shape docking pose as reported by Nagahara et al. [35]. The carbon atoms of the ligand are shown in light orange and for the receptor are coloured according to PIE values calculated by FMO. Nitrogen atoms are shown in blue, oxygen in red, sulfur in yellow and chlorine in light green. (B) Plot describes sorted PIE of the most significant residues and (C) plots describe the PIEDA of these key interactions. PIE terms: electrostatics, dispersion, charge-transfer and exchange repulsion are coloured coded yellow, blue, red and green respectively.

