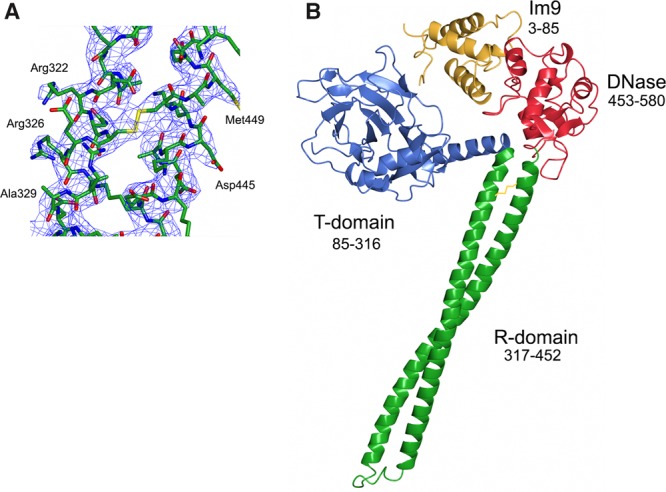
Figure 2. Crystal structure of ColE9.

(A) Electron density (2Fo − Fc shown at 1σ cut-off) of R-domain region with stabilizing disulphide bond. (B) Structure of the ColE9–Im9 complex shown in cartoon representation with each of the colicin domains labelled. ColE9 T-domain coloured blue, R-domain coloured green, DNase domain coloured red, and Im9 coloured yellow. No electron density for ColE9 residues 1–84 was observed, which is a region known from NMR spectroscopy to be intrinsically disordered [27].
