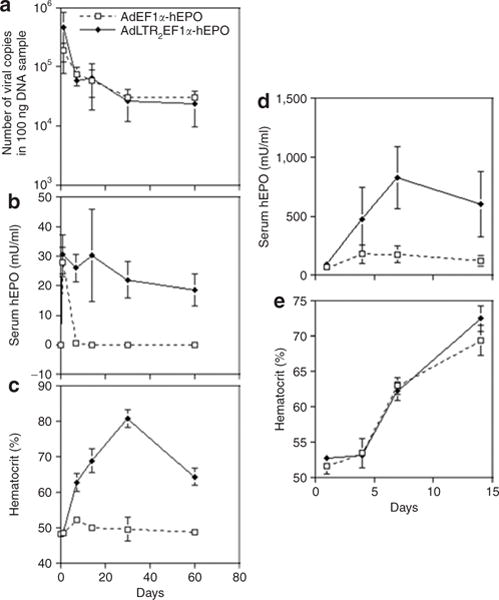
Figure 3. Early time-course of glandular vector copy number, serum human erythropoietin (hEPO) expression, and hematocrit levels after vector delivery to submandibular glands and femoral veins in rats.

(a) Time-course of vector copy numbers after vector (109 particles) delivery in rats to one submandibular gland in each animal. The animals received either AdLTR2EF1α-hEPO or AdEF1α-hEPO. The data shown are mean values ± SD for glands from three rats. The vector copy number was determined using quantitative PCR and primers for the hEPO cDNA (see Materials and Methods). The data were analyzed using a one-way analysis of variance, and no significant differences over this time-course were found between the two vectors. (b) Time-course of hEPO levels measured for the same rats as are shown in a. The data shown are mean values ± SD. (c) Time-course of hematocrit levels measured for the same rats as are shown in a. The data shown are mean values ± SD. (d) Time-course of hEPO levels after systemic vector (109 particles) delivery to 6 rats through the femoral vein. The animals (n = 3/group) received either AdLTR2EF1α-hEPO or AdEF1α-hEPO. The data shown are mean values ± SD. Note the difference in the y-axis scale from b. (e) Time-course of hematocrit levels measured for the same rats as are shown in d. The data shown are mean values ± SD. Ad, adenovirus; EF1α, elongation factor-1α; LTR, long-terminal repeat.
