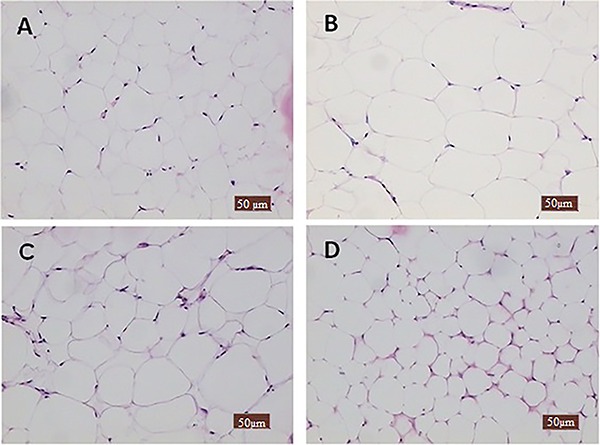
Figure 3. Histology of adipose tissue of mice fed the experimental diets for 15 weeks. Representative microphotographs of mouse epididymal fat pad (A), normal diet showing normal architecture of adipocytes (B), high-fat diet showing an increased size adipocyte (C), high-fat diet+ferulic acid treatment, and (D), high-fat diet+sibutramine treatment, which presents smaller adipocytes compared to normal diet-fed animals (H&E, ×100).

