
Figure 6.
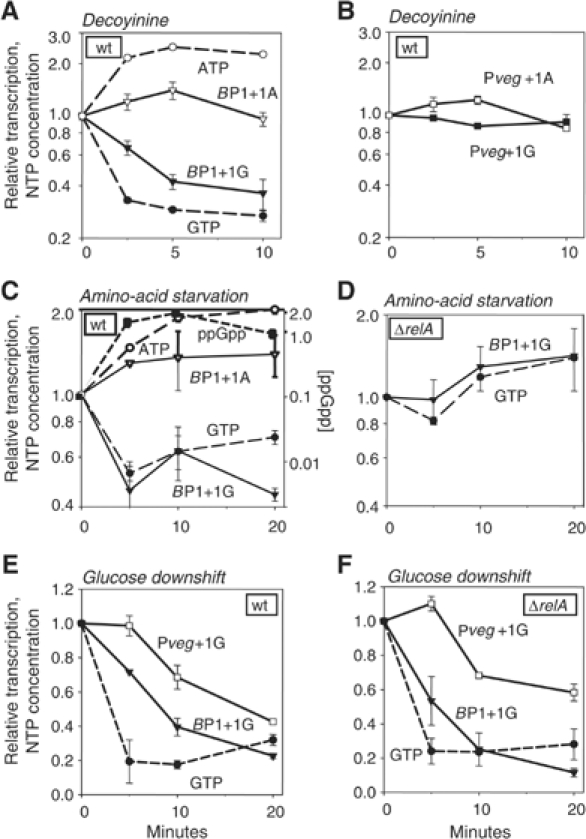
Correlation between GTP concentration and B. subtilis rrnB P1 promoter activity following three kinds of downshifts. NTP concentrations (dashed lines) and promoter activities (solid lines) are normalized to 1 at time 0. The GTP concentration was 45, 18, and 46% of the ATP concentration at time 0 in panels A, C, and E, respectively. Promoter activities were measured by primer extension from a wild-type strain: rrnB P1+1G (RLG7554), rrnB P1+1A (RLG7585), Pveg+1G (RLG7555), Pveg+1A (RLG7376), or from a ΔrelA strain: rrnB P1+1G (RLG7580), Pveg+1G (RLG7581). (A, B) Changes in promoter activity and NTP concentration after decoyinine addition. Cells were grown in a medium containing MOPS, 1% glucose, and 20 amino acids (50 μg/ml each). Decoyinine (final concentration 0.5 mg/ml) was added to exponentially growing cells at time 0 (OD600∼0.3). (C) Effect of amino-acid starvation on B. subtilis rrnB P1 promoter activity. Cells were grown in a medium containing MOPS, 0.4% glucose, and six amino acids (FILMVW). Serine hydroxamate (1.5 mg/ml final concentration) was added to exponentially growing cells at time 0 (OD600∼0.25). The ppGpp concentration is presented relative to the GTP concentration. Note the different scale for ppGpp. (D) Effect of amino-acid starvation on B. subtilis rrnB P1 promoter activity in a ΔrelA strain. Conditions are as in (C). (E) Effect of glucose deprivation on B. subtilis rrnB P1 promoter activity. Cells were grown in a medium containing MOPS, 0.2% glucose, and 20 amino acids. α-Methyl glucoside (final concentration 2%) was added to exponentially growing cells at time 0 (OD600∼0.3). The decrease in ATP concentration was ∼2-fold by 5 min (data not shown). (F) Effect of glucose deprivation on B. subtilis rrnB P1 promoter activity in a ΔrelA strain. Conditions are as in (E).