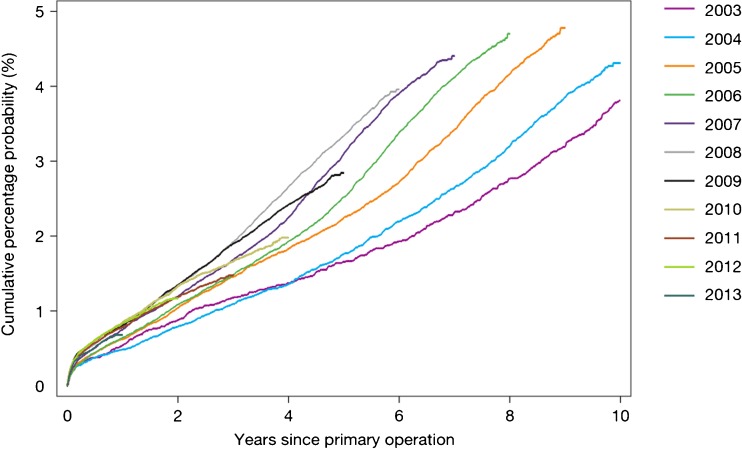
Fig. 8.
Temporal changes in revision rates: Kaplan-Meier estimates of cumulative percentage probability of revision for each year of primary operation (from the 2014 report from the National Joint Registry for England, Wales and Northern Ireland, Figure 3.3a www.njrcentre.org.uk).

