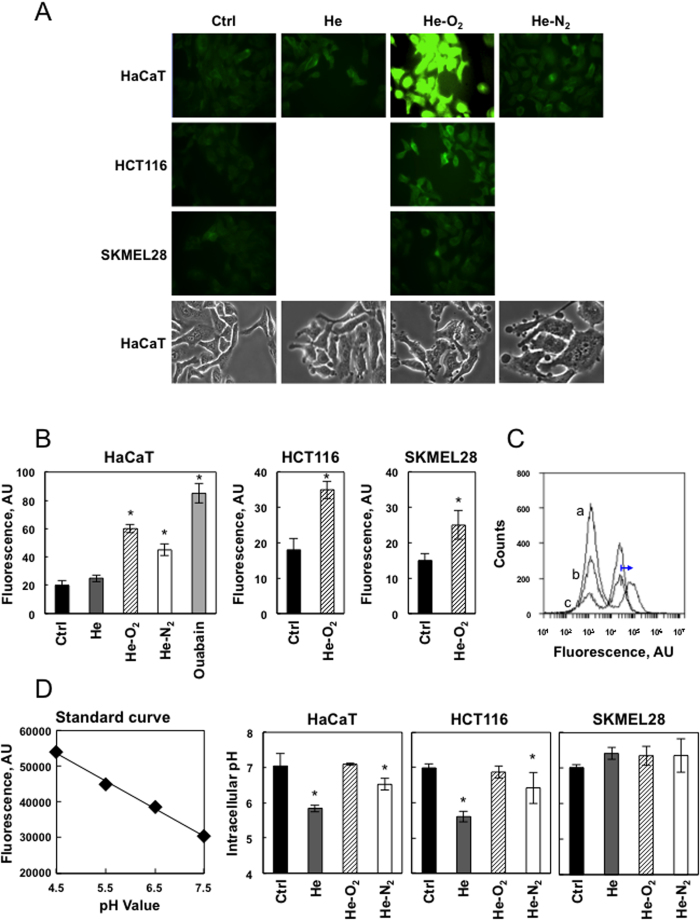
Figure 2. Effect of plasma treatment on membrane potential and cytosolic pH.
(A) Cell membrane depolarization after CAPP treatment. HaCaT, HCT-116 and SK-MEL-28 cells were loaded with FluoVoltTM membrane potential dye which exhibits higher intensity with membrane depolarization, and exposed to plasma treatment (He, He-O2 and He-N2) for 5 min and imaged. Cell morphology was monitored by phase contrast microscopy after treatment. B. Data points are mean pixel intensity ± SEM (n = 10 cells) *P < 0.05. Ouabain was used as a control for total cell depolarization. (C) Investigation of the transmembrane potential of Hacat cells by the probe DiBAC4(3) after PAL treatment. Cells were loaded with DiBAC4(3)dye which exhibits enhanced fluorescence and a red spectral shift with membrane depolarization, and exposed to PAL treatment (He, He-O2) for 1 h. Cells were analyzed by flow cytometry using valinomycin which is a potassium ionophore as a control of total cell depolarization (a, valinomycin, b, PAL-He, and c, PAL- He-O2). (D) Standard curve created using pHrodo™ Green AM with Intracellular pH Calibration Buffer Kit. HaCaT cells were incubated with 10 μM pHrodo™ Green AM for 30 min at 37 °C. The Intracellular pH Calibration Buffer Kit was used to clamp the intracellular pH with extracellular buffer at pH 4.5, 5.5, 6.5 and 7.5. Intracellular pH vs. relative fluorescence units were plotted using a microplate fluorimetric reader. HaCaT, HCT-116 and SKMEL-28 cells were loaded with pHrodo™ Green AM and exposed to plasma treatment (He, He-O2 and He-N2) for 5 min and cytosolic pH was measured. Data, mean ± SEM from three independent cultures, *P < 0.05.

