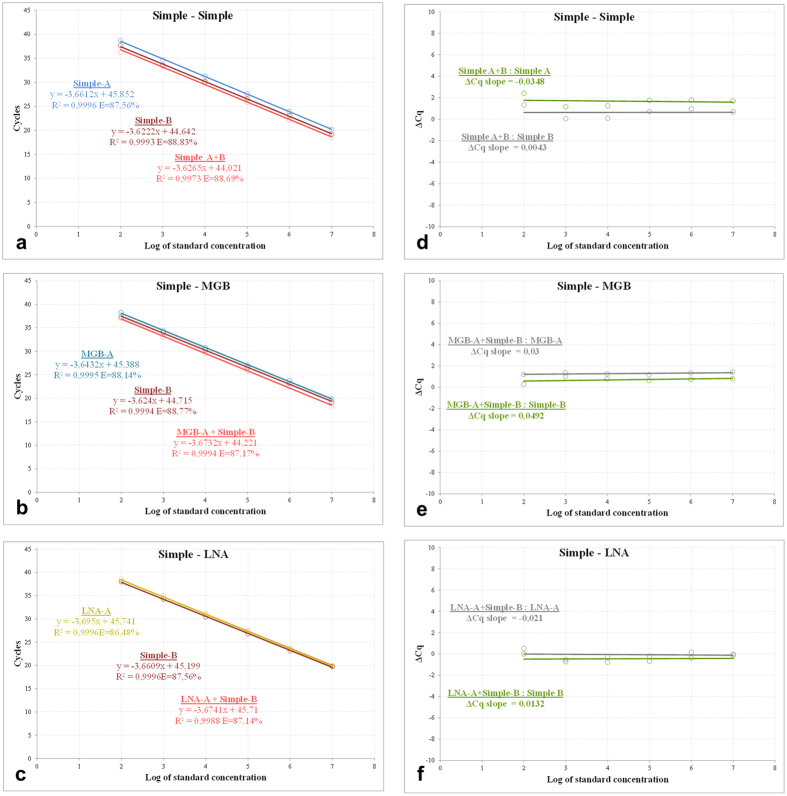
Figure 4. Calibration and ΔCq curve analysis of dual-probe TaqMan qPCR assays.
Calibration (a–c) curves of the simple-simple, simple-MGB and simple-LNA dual-probe assays in opposite orientations. The curves were prepared for a dilution gradient from 1e2 to 1e7 NA standard copies per μl of template in triplicates. The dual-probe assays are highlighted in red and the corresponding single-probe counterparts in probe-specific colours. The probe sequences and their schematic representation and colouring are shown in Figs 1 and 2. The ΔCq curves (d–f), representing the Cq differences between the dual-probe versus the corresponding A and B assays at each concentration point, were coloured in green and grey, respectively. For the data regarding additional dual-probe assays, either in opposite or tandem orientations, please refer to Supplementary Information 1, Figure S1.2 and Supplementary Information 2, Figure S2.2, respectively.

