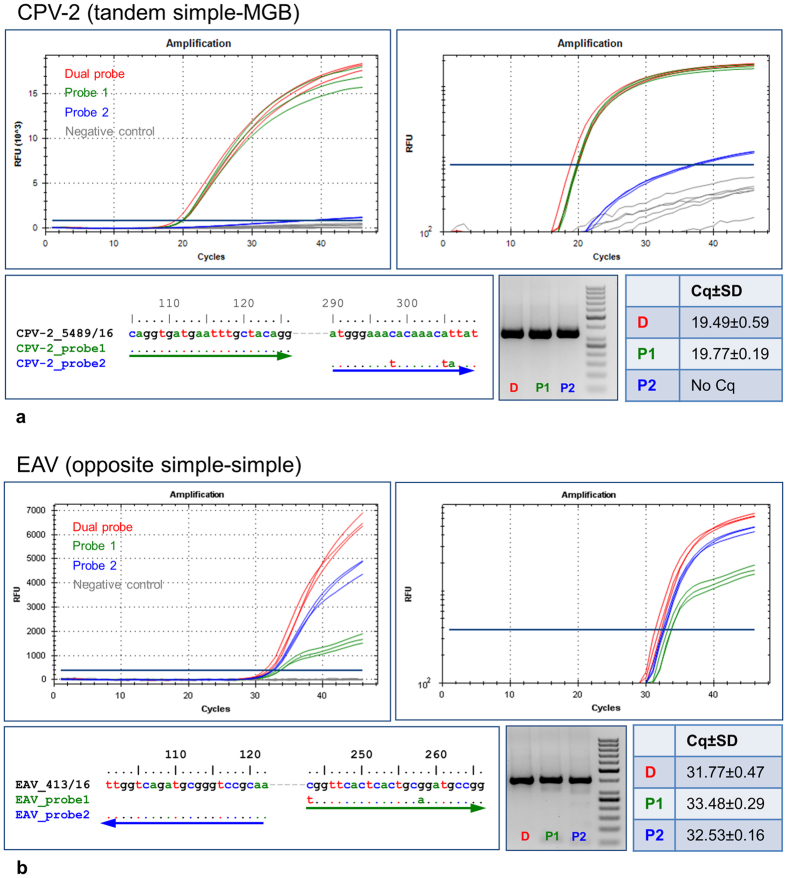
Figure 6. Demonstration of utility of dual-probe TaqMan qPCR in diagnostic microbiology.
The amplification curves of the dual-probe CPV-2 qPCR (tandem simple-MGB configuration, (a) and EAV RT-qPCR (opposite simple-simple configuration, (b), and the related single-probe assays (Supplementary Information 3, Table S3.1), shown in classical and logarithmic representation. All reactions were performed in triplicates. The dual-probe assays were highlighted in red and the probe1 and probe2 assays with green and blue, respectively. Each analysis was supplemented with the probe-to-template sequence alignment, with arrows in corresponding colours indicating the probe directions. The electrophoreograms compare the amplification products (one replicate), and the tables the mean Cq values between the assays. Additional examples were shown in Supplementary Information 3, Figure S3a–c.

