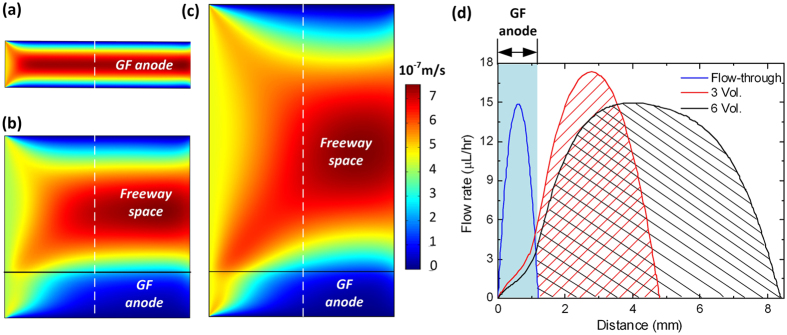
Figure 3.
Simulated flow rate distributions over the vertical cross-section of the anolyte chambers of three sample μMFCs: a FT (a), and two non-FT devices with the freeway space height (above the GF anode) three (b) and six times (c) the thickness of the GF anode. In (d), simulated flow rates along the dashed white lines across the width of the anolyate chambers are given.

