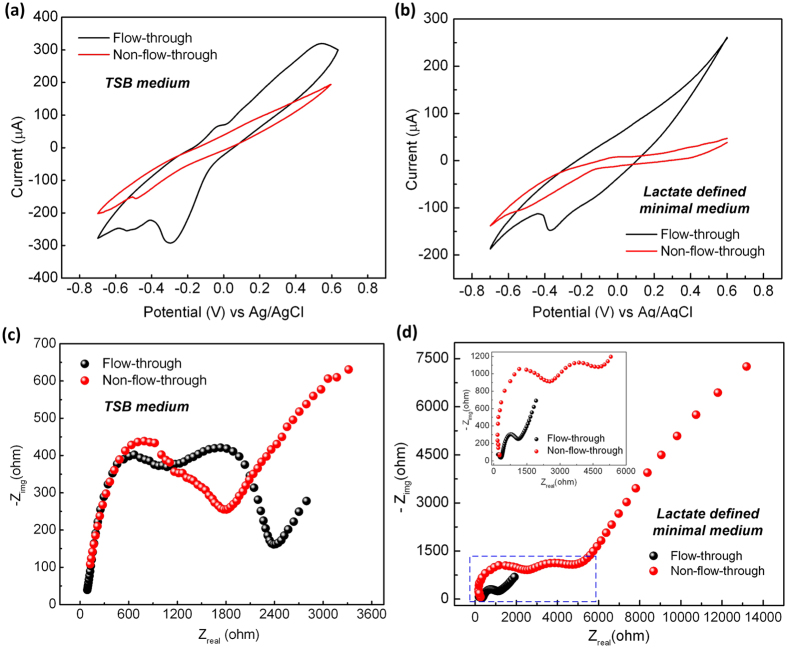
Figure 8.
Overlay of CV characteristic curves of the GF anodes in the microfluidic FT and non-FT μMFCs at the scan rate of 30 mV/s with TSB medium (a) and lactate defined minimal medium (b). Nyquist plots of the GF anodes for the microfluidic FT and non-FT devices with TSB medium (c) and lactate defined minimal medium (d) in EIS studies. The inset in (d) shows the enlarged view of the indicated square region in the same figure.

