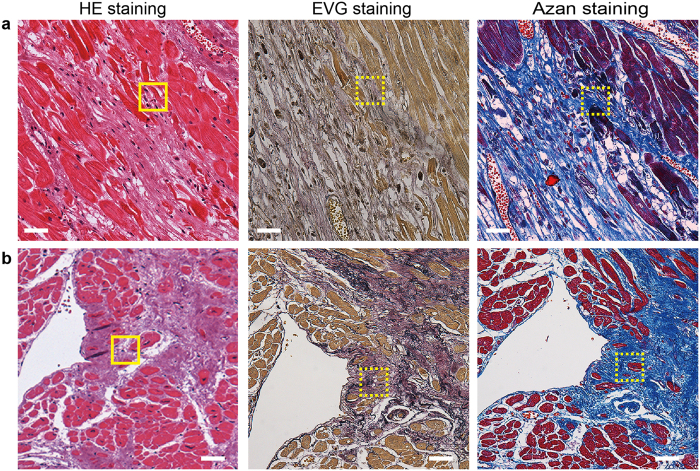
Figure 3. Staining of collagenous tissue in the infarcted human heart.
Left panels indicate the lower magnification of HE staining shown in Fig. 2. Solid squares in (a and b) indicate the area enlarged in Fig. 2d and e, respectively. EVG (middle panels) and Azan (right panels) staining images obtained from one of the sections of a series of tissue sectioning from the same heart tissue of the HE staining. Dotted squares in EVG and Azan staining images are near area in z-axis direction where PrP+ cTnT+ cells was observed. Bar, 50 μm.

