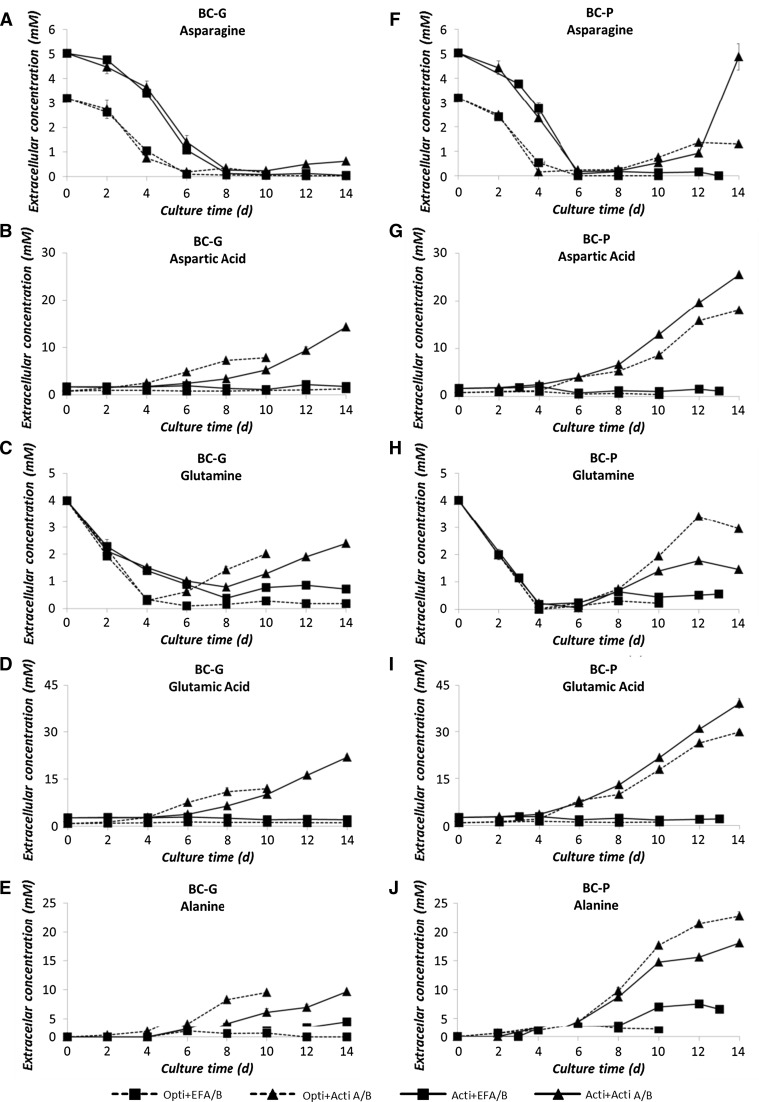
Fig. 7.
Non-essential amino acid profiles of selected culture conditions in fed-batch cultures. Concentrations are shown in mM. Graph a, b, c, d, e show the profiles of asparagine, aspartic acid, glutamine, glutamic acid and alanine of the BC-G clone; Graph f, g, h, i, j show their profiles of the BC-P clone. Error bars show the deviation of the duplicate data points from the average value

