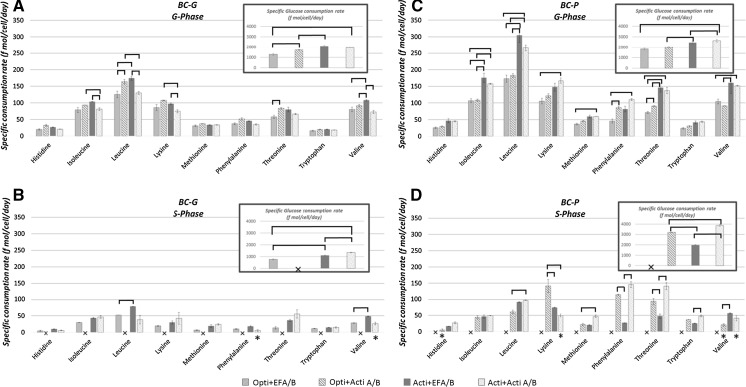
Fig. 8.
Average specific consumption rates (f fmol·cell−1 day−1) of the 9 essential amino acids and glucose of the BC-G (a, b) and the BC-P (c, d) clones in the selected fed-batch culture conditions. G-Phase growth phase; S-Phase stationary phase. Average specific consumption rates of the conditions indicated with (×) and (*) cannot be calculated due to early cell death and inaccurate (R2 < 0.8) specific consumption rate calculations, respectively. “ ” shows a significant (P < 0.05) difference between the linked two values

