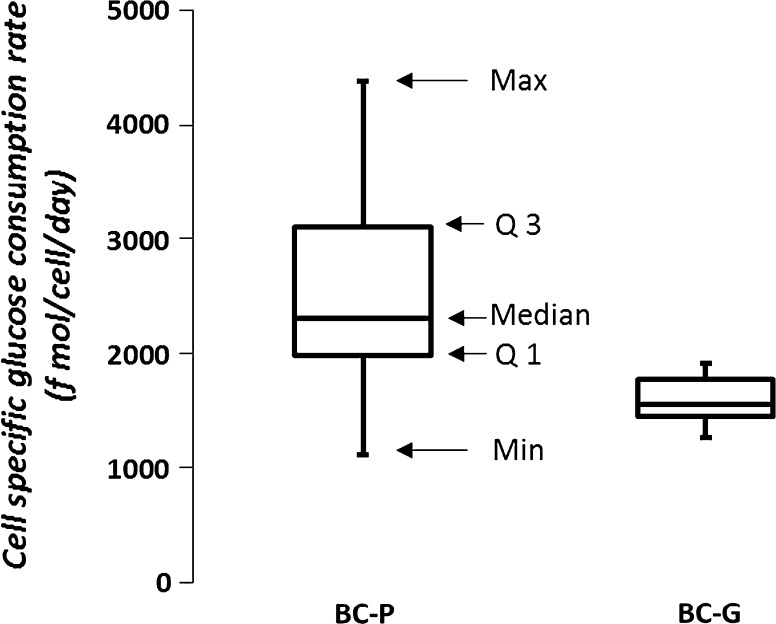
Fig. 9.
Overall cell specific glucose consumption rates (f mol/cell/day) for the BC-P and BC-G clone ranges observed in all the tested conditions. The maximum (Max), minimum (Min), median, quartile 1 (Q1), and quartile 2 (Q2) values are shown by arrows for the BC-P clones; same follows for the BC-G clone

