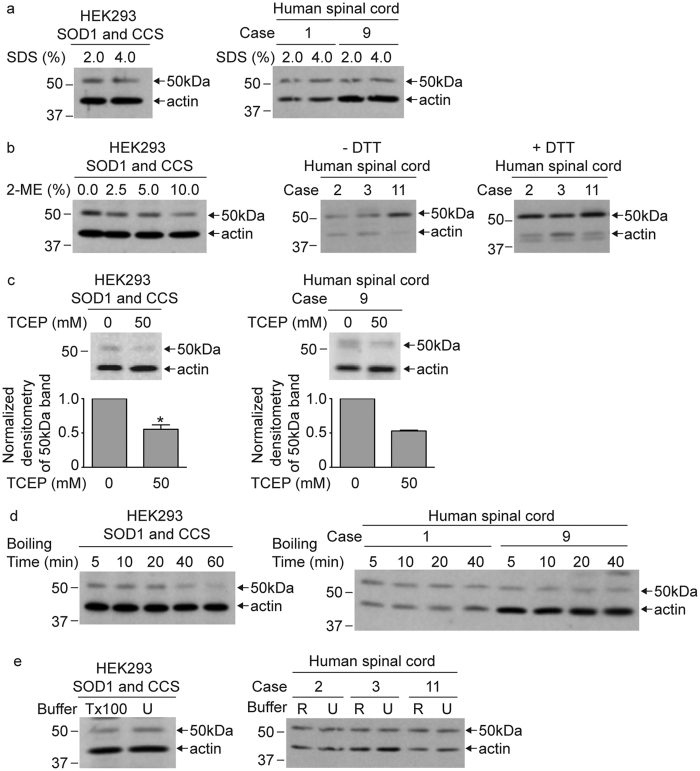
Figure 4. The SOD1 and CCS heterodimer is resistant to denaturing conditions and disulfide reduction.
(a) Equal amounts of total protein from HEK293 cell lysates transiently co-expressing SOD1 and CCS or human spinal cord lysates were combined with Laemmli buffer containing either 2% SDS or 4% SDS. Each sample was treated with 100 mM DTT and boiled for 5 min. (b) Equal amounts of total protein from HEK293 cell lysates transiently co-expressing SOD1 and CCS were combined with Laemmli buffer containing 2% SDS and treated with increasing amounts of 2-mercaptoethanol (2-ME). Equal amounts of total protein from human spinal cord lysates were combined with Laemmli buffer containing 2% SDS and were either treated or not with 100 mM DTT. All samples were boiled for 5 minutes. (c) Equal amounts of total protein from HEK293 cell lysates transiently co-expressing SOD1 and CCS or a human spinal cord lysate (FALS case 9) were combined with Laemmli buffer containing 2% SDS and were either treated or not with 50 mM TCEP. All samples were boiled for 5 minutes. The bar graphs provide the average normalized densitometry of the 50 kDa band displayed as a fraction of the untreated samples. The error bars represent the standard error of the mean (n = 3 experiments for HEK293 cells, *P < 0.05; n = 2 experiments for human spinal cord). (d) Equal amounts of total protein from HEK293 cell lysates transiently co-expressing SOD1 and CCS or human spinal cord lysates were combined with Laemmli buffer containing 2% SDS and 100 mM DTT. Samples were subsequently boiled for the indicated time points. (e) HEK293 cells transiently co-expressing SOD1 and CCS were solubilized in either lysis buffer containing 1% Triton X-100 (Tx100) or 4 M urea and treated with 100 mM DTT. Human spinal cord lysates were solubilized in either RIPA buffer (R) or lysis buffer containing 6 M urea (U) and treated with 100 mM DTT. Samples were boiled for 5 min, with the exception of the urea containing samples. All samples were subjected to standard Western blot analysis with anti-SOD1, anti-CCS, and anti-actin antibodies. Full-length images of Western blots are presented in Supplemental Fig. S4.

