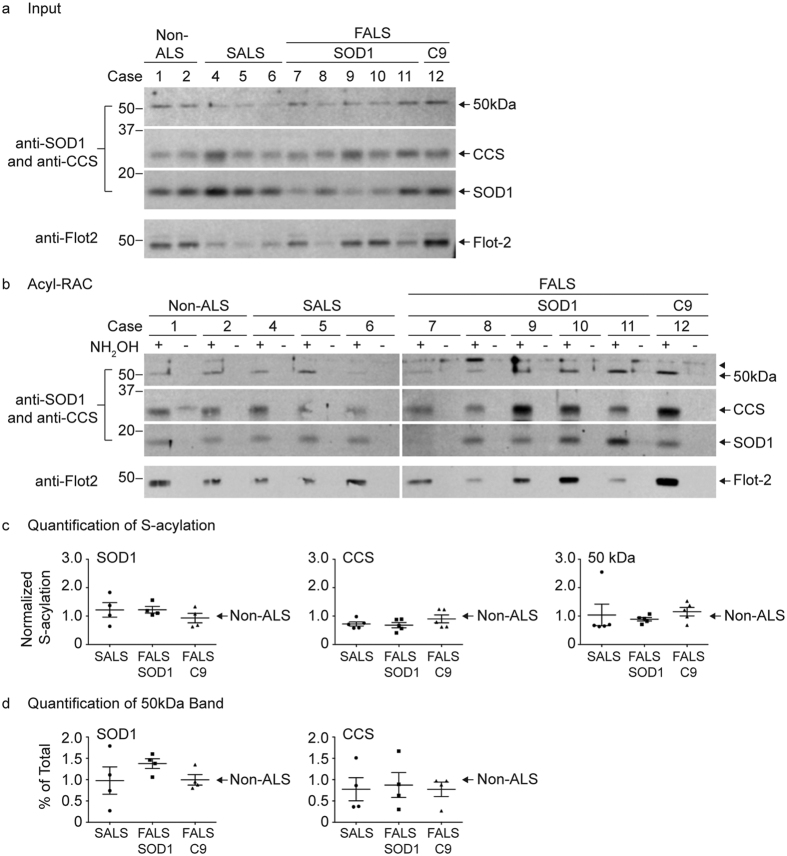
Figure 5. Quantitative acyl-RAC analysis of SOD1 and CCS S-acylation in human spinal cords.
(a) Equal amounts of acyl-RAC input protein from human spinal cord lysates were analyzed by Western blotting with anti-CCS (10 μg total protein loaded) and anti-SOD1 (5 μg total protein loaded) antibodies. The anti-CCS Western blot was subsequently stripped and analyzed by Western blotting with an anti-flotillin-2 antibody (10 μg total protein loaded). (b) Equal amounts of total protein lysates from human spinal cords were processed for acyl-RAC. 100% of +NH2OH acyl-RAC bound protein and 100% of −NH2OH acyl-RAC bound protein were analyzed by Western blotting with anti-SOD1 and anti-CCS antibodies. The same Western blots were subsequently stripped and analyzed by Western blotting with an anti-flotillin-2 antibody. (c) The densitometry values were determined by dividing the +NH2OH acyl-RAC bound protein signals by the corresponding input protein signals. The normalized densitometry values were then averaged for each group and all groups were normalized to the non-ALS control average per experiment. Normalization was only done for results within the same experiment in which all samples were processed in parallel. Graphs provide average normalized densitometry data from multiple experiments displayed as a fraction of the non-ALS control group, which is set to one. The horizontal lines represent the mean relative S-acylation level for each group and the error bars represent the standard error of the mean (n = 4 experiments for the SOD1 monomer; n = 5 experiments for the CCS monomer and 50 kDa band). (d) Densitometry analysis was done to determine the ratio of the 50 kDa band as a percentage of total SOD1 or total CCS (50 kDa band densitometry values divided by the sum of the SOD1 or CCS monomer and 50 kDa band densitometry values). Percent of total ratios were then averaged for each group and all groups were normalized to the non-ALS control average per experiment. Graphs provide average percent of total values displayed as a fraction of the non-ALS control group, which is set to one. The horizontal lines represent the mean relative percent of total for each group and the error bars represent the standard error of the mean (n = 4 experiments). Full-length images of Western blots are presented in Supplemental Fig. S5.

